3.6 Measuring Social Inequality: Putting People at the Center
How do we measure the quality of life that a country’s population can have, and how do we make comparisons with other countries? Let’s look at a few ways: levels of poverty, life expectancy, and the Human Development Index.
3.6.1 Poverty
Another way to evaluate global stratification is to consider how many people are living in poverty, particularly extreme poverty. To indicate the level of poverty within a nation or region, researchers calculate the percentage of the population living beneath various poverty thresholds. One common threshold is the International Poverty Line, needing to survive on less than $1.90 per day.These measurements of poverty bring the experiences of people into focus.
Poverty levels vary greatly across countries. Fortunately, until the COVID-19 pandemic impacted economies in 2020, the extreme poverty rate had been on a 20-year decline. In 2015, 10.1 percent of the world’s population was living in extreme poverty; in 2017, that number had dropped an entire percentage point to 9.2 percent. While a positive change, that 9.2 percent is equivalent to 689 million people living on less than $1.90 a day (World Bank 2020). Figure 3.21 makes the differences in poverty clear.
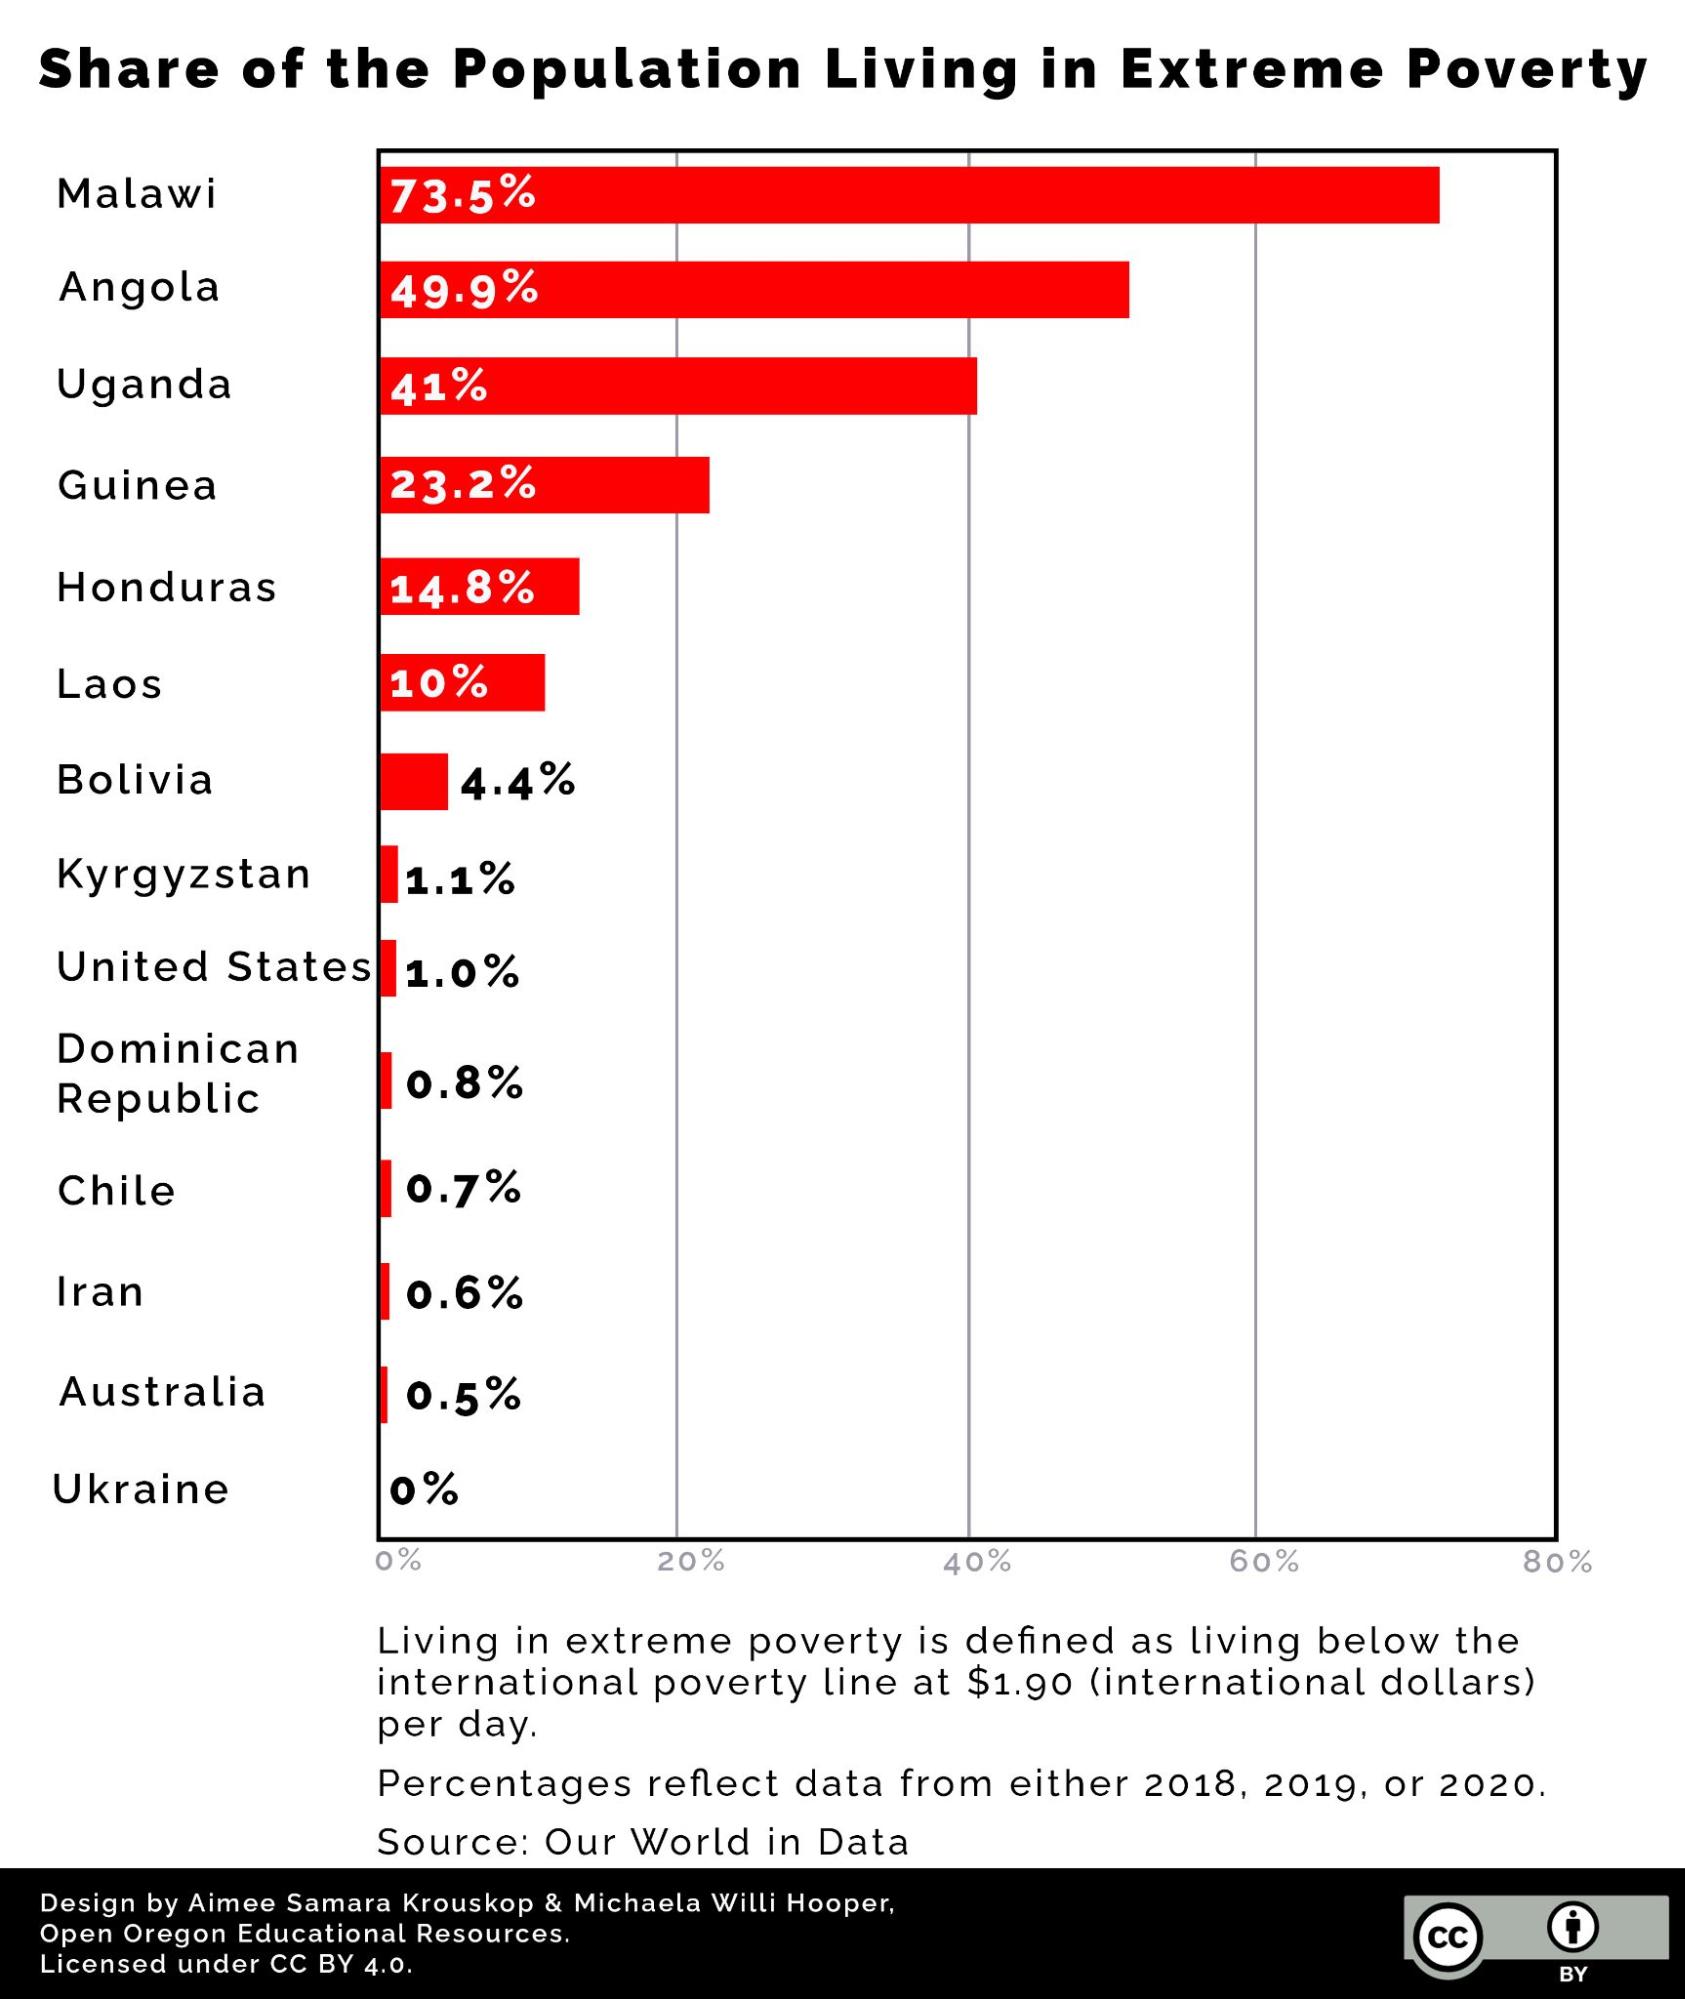
Figure 3.21. Share of the Population Living in Extreme Poverty. The differences among countries is clear when considering their extreme poverty rates. For the most part, the selected countries show disparities even within countries from the same regions.
The global Multidimensional Poverty Index (MPI) measures severe poverty across more than 100 developing countries with three dimensions: health, education, and standard of living. Figure 3.22 shows how those dimensions are broken down in more detail. For example, access to cooking fuel, sanitation, drinking water, electricity, housing and assets are examined to determine standard of living.
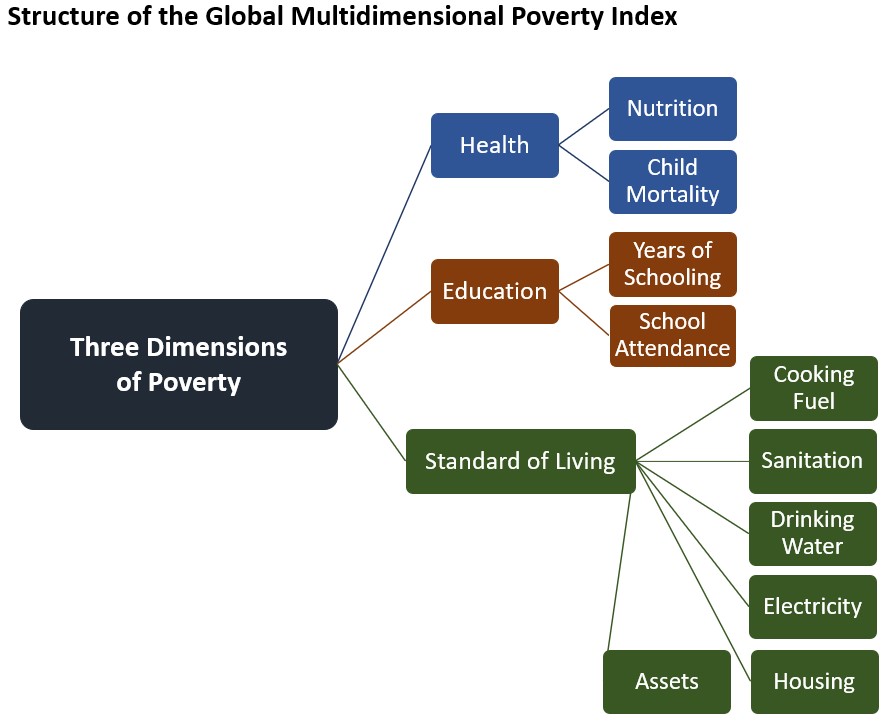
Figure 3.22 Structure of the global Multidimensional Poverty Index
3.6.2 Life Expectancy
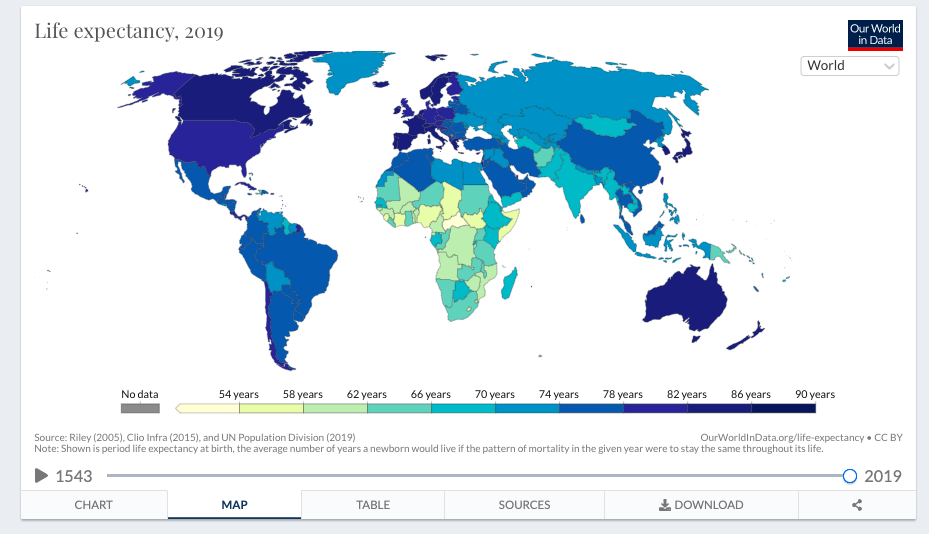
One of the most striking measurements of global stratification between countries is life expectancy, or the number of years a person can expect to live. By definition, life expectancy is based on an estimate of the average age that members of a particular population group will be when they die. As you might expect, people in poorer countries have lower life expectancies than people in wealthier countries. However, life expectancy can also vary significantly within countries.
Visit the Life expectancy map of the Our World in Data site to see country comparisons between countries of life expectancy in 2019. Play the animation to see how life expectancy between nations has changed over time. Figure 3.23 shows life expectancy illustrated by that map in 2019. You can also click the tabs below the animated tools on that page to see data in chart or table form. What do you notice about differences in life expectancy across the globe?
Figure 3.23. Life Expectancy page of the Our World in Data site.
3.6.3 Human Development Index
The criticisms and limitations of using GDP has led over the years to the creation of several alternative measurements. One of these is the Human Development Index (HDI), developed by Pakistani economist Mahbub ul Haq in 1990 and adopted by the United Nations Development Program (UNDP).
The HDI is a composite measure that combines a nation’s GDP with many other important quality of life considerations, such as life expectancy at birth as a measure of health, security, the adult literacy rate and enrollment in primary, secondary, and higher education as measures of education, and the effects of environmental degradation people experience. Figure 3.24 shows an image that the UNDP created to illustrate components of the HDI.
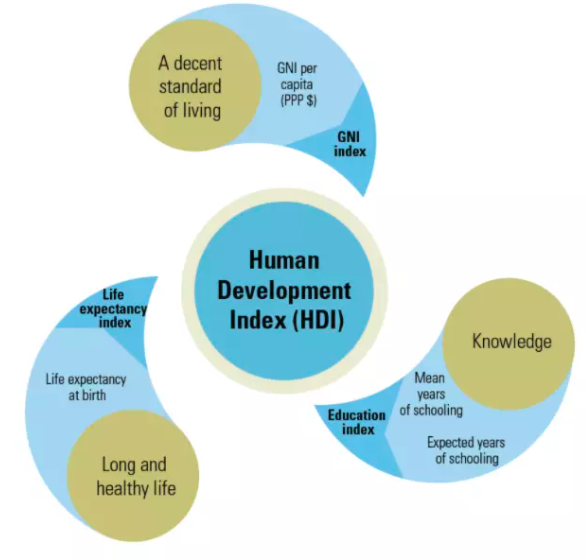
Figure 3.24. UNDP’s illustration of the Human Development Index (HDI).
The HDI expresses the capabilities of people’s potential achievement. By using both financial and non-financial factors, it paints a deeper picture of the lives and issues in a region. For example, a nation with high income but low education will still have difficulty in overall opportunity.
Figure 3.25, shows how nations rank according to the HDI in 2008. This map looks fairly similar to the map in figure 3.7 “Global Stratification Map” that was based only on GDP per capita; the nations that rank high on human development are the wealthiest nations, and those that rank lowest on human development, such as Ethiopia and Rwanda, are the poorest nations.
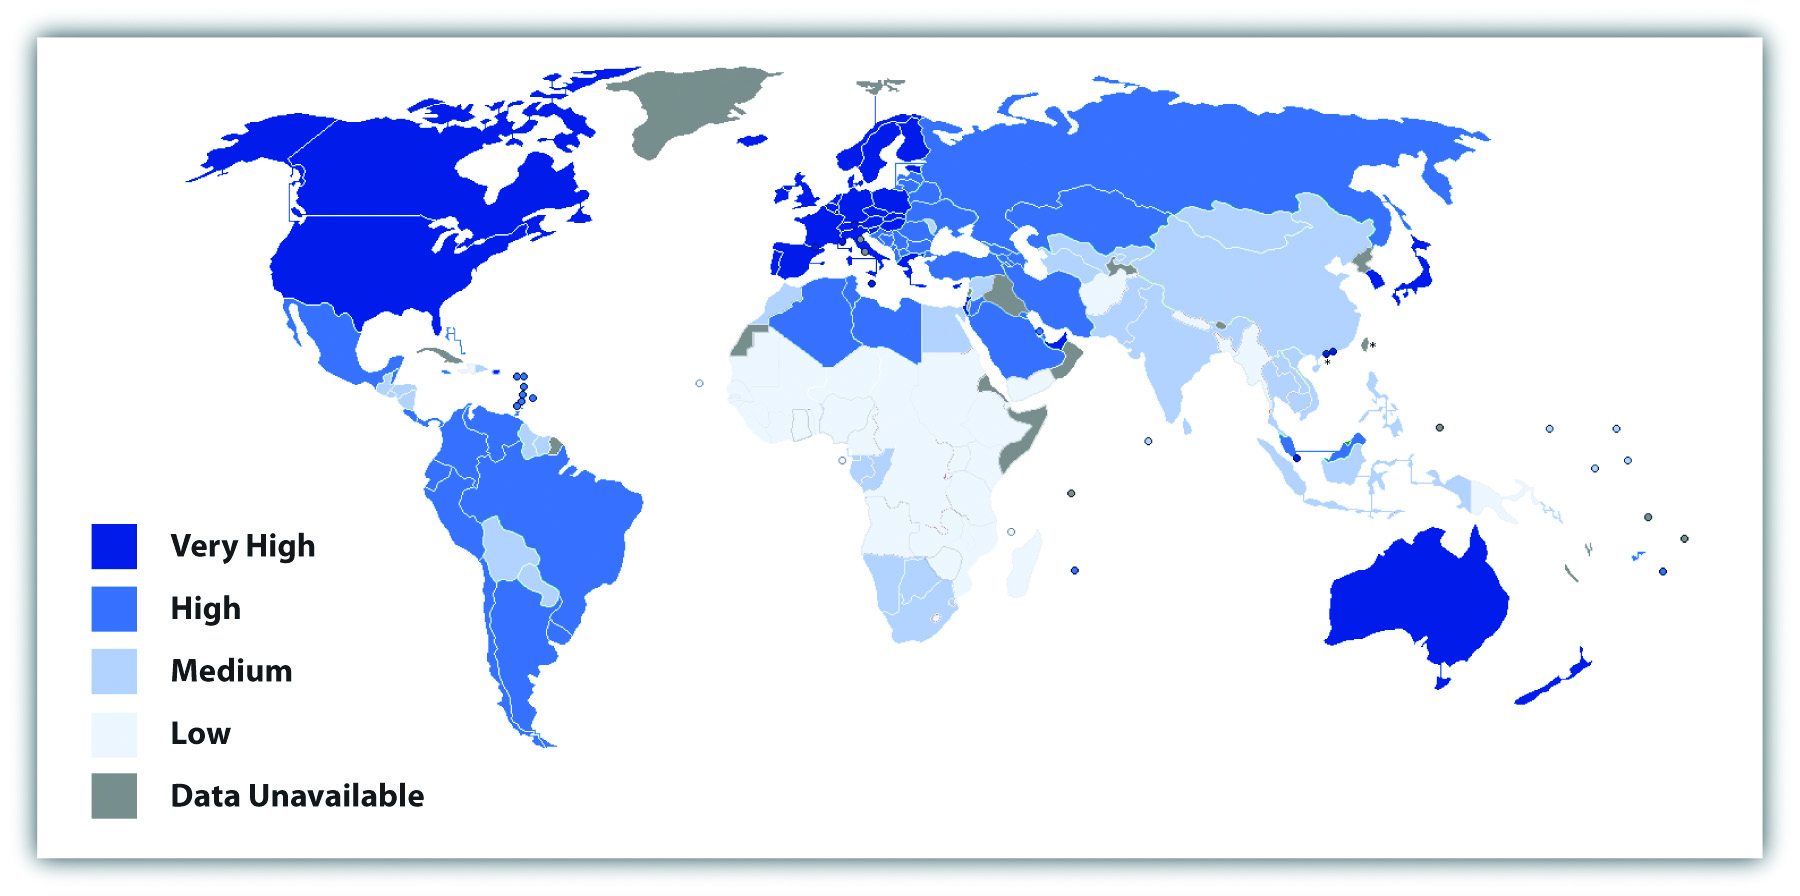
Figure 3.25. International Human Development ranks in 2008
Image Description
The HDI has been widely used since the 1990s and reminds us that nations differ dramatically not only in their economic well-being but also in their social well-being.
3.6.4 Going Deeper
- For more information on the use of the terms Third World and Developing Nations see “What Does ‘Third World Country Mean?
- For more information on Poverty watch this 9:01-minute video, “Globalization and Trade and Poverty: Crash Course Economics #16”
- For information on trends in health and development, see The World Health Organization’s Global Health Observatory
- For country information on many demographic and wellbeing aspects of any specific country see the CIA World Factbook
- For rankings of countries according to the basic Human Development Index, the Gender Equality Index and more, see the United Nations Development Program Human Development Data Center and the World Bank Open Data site.
3.6.5 Licenses and Attributions for Measuring Social Inequality – Putting People at the Center
“Measuring Social Inequality – Putting People at the Center” by Aimee Samara Krouskop is licensed under CC BY 4.0.
Poverty is a remix of “Global Extreme Poverty” Published online at OurWorldInData.org
by Max Roser and Esteban Ortiz-Ospina (2013) licensed with Creative Commons BY license retrieved from: https://ourworldindata.org/extreme-poverty [Online Resource] and Introduction to Sociology; First Canadian Edition, Chapter 10 Global Inequality, published by BC Campus with CC Attribution 4.0 International license and found here.
Figure 3.21. Share of the Population Living in Extreme Poverty by Aimee Samara Krouskop and Michaela Willi Hooper, Open Oregon Educational Resources is licensed under CC BY 4.0. Based on data from Our World in Data.
Figure 3.22. Structure of the Global Multidimensional Poverty Index by Aimee Samara Krouskop and Michaela Willi Hooper, Open Oregon Educational Resources is licensed under CC BY 4.0. Based on data from Unpacking deprivation bundles to reduce multidimensional poverty, Global Multidimensional Poverty Index 2022.
Life Expectancy by Aimee Samara Krouskop is licensed under CC BY 4.0.
Human Development Index is a remix of The Nature and Extent of Global Stratification, published by The University of Regina OER Publishing Program licensed with xxxx and found here. Modified to add UNDP’s illustration of the Human Development Index (HDI) and the (UNDP) Global Human Development Indicators page
Figure 3.23 is a screenshot from the Life Expectancy page of the Our World in Data site licensed with CC BY 4.0.
Figure 3.24. Illustration of the Human Development Index (HDI) published by the UNDP and licensed with CC BY 3.0 IGO can be found here. Figure 3.24. International Human Development 2008 and the explanatory content before and after the image is a remix of chapter 9.1 “The Nature and Extent of Global Stratification” in Sociology: Understanding and Changing the Social World published by the University of Minnesota and licensed with (CC BY-NC-SA 4.0). Find the chapter here.
Figure 3.25. International Human Development, 2008
Source: Adapted from United Nations Development Programme. (2010). International human development indicators. Retrieved from http://hdr.undp.org/en/data/map.

