7.3 Who Gets Educated?
Part of our understanding of education is that it serves a purpose in society, for positive or painful ends. Education can also be a driver of social change.
Most people in the world can read and write, something that wasn’t true even a hundred years ago. Although men and boys have more chances to go to school than women and girls, the gender gap in education is closing in the United States and around the world. (Roser and Ortiz-Espinosa 2022) Recently, evidence shows that young women in the United States are more likely to attend and complete college than men. (Pew Research 2021). These positive results in creating equal access to education don’t tell the whole story, though.
From Chapter 2, you might remember the concept of intersectionality. The experience of any group depends on the intersection of power and privilege based on the combination of their race, class, age, sexual orientation, gender, and other social locations. Sociologists often look at inequality in education based on just race, or just class, or just gender, for example. However, we know that explanations that take multiple locations into account are more useful when we want to make sense of the social world. In this section we will look at the intersection of race and socioeconomic class (SES).
7.3.1 Race and Class
Differences in educational opportunities and educational outcomes are partially linked to school spending. Unlike many other countries, where school spending is decided by the federal government, the United States allows each state to determine the education budget and how to spend it. Although school districts may be funded by federal funds, we see significant state and local variations in student spending. Feel free to look at this report on Educational Spending in the United States. At the end of the article, there is an interactive map of the US that shows the per pupil spending for each state.
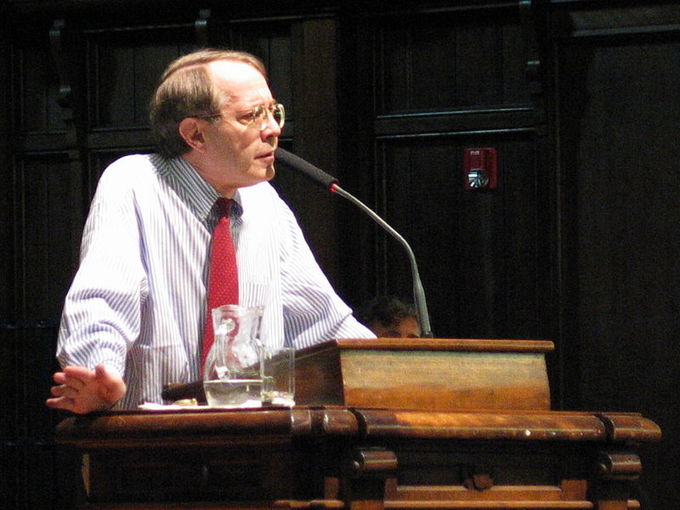
White Jewish author and educator Jonathan Kozol (figure 7.9) examines the class- and race-based disparities in education in his book Savage Inequalities. The book is based on Kozol’s observations of classrooms in the public school systems of East St. Louis, Chicago, New York City, Camden, Cincinnati, and Washington, D.C. Kozol observed students in schools with the lowest and highest spending per student, ranging from just $3,000 per student in Camden, New Jersey, to up to $15,000 per student, per year in Great Neck, Long Island. (His numbers are slightly lower than the map reference in Educational Spending in the United States, because his research occurred in 1991).

Figure 7.9. Jonathan Kozol at Pomona College. Savage Inequalities, a 1991 book by Jonathan Kozol, examines the class- and race-based disparities in education.
Kozol’s observations illustrated the disparities between schools. In poor schools, students face overcrowding, unsanitary conditions, and understaffed buildings where even basic tools and textbooks might be missing. These schools tend to be located in areas with large proportions of minorities, high rates of poverty, and high taxation rates. But high taxation rates on low-value property do not generate much revenue, and these schools remain underfunded. Kozol argues that property taxes are an unjust funding basis for schools, one that fails to challenge the status quo of racial-based inequality. Even when state funding is used to partially equalize the funding between districts, inequalities aren’t erased. In Kozol’s words, “Equal funding for unequal needs is not equality. ”
Kozol concludes that these disparities in school quality perpetuate inequality and constitute de facto segregation, segregation that occurs without laws but because of other factors. He argues that racial segregation, the physical separation between two groups, particularly in residences, workplace and social functions, is still alive and well in the American educational system; this is due to the gross inequalities that result from unequal distribution of funds collected through both property taxes and funds distributed by the state in an attempt to “equalize” the expenditures of schools.
7.3.2 Differences between Countries

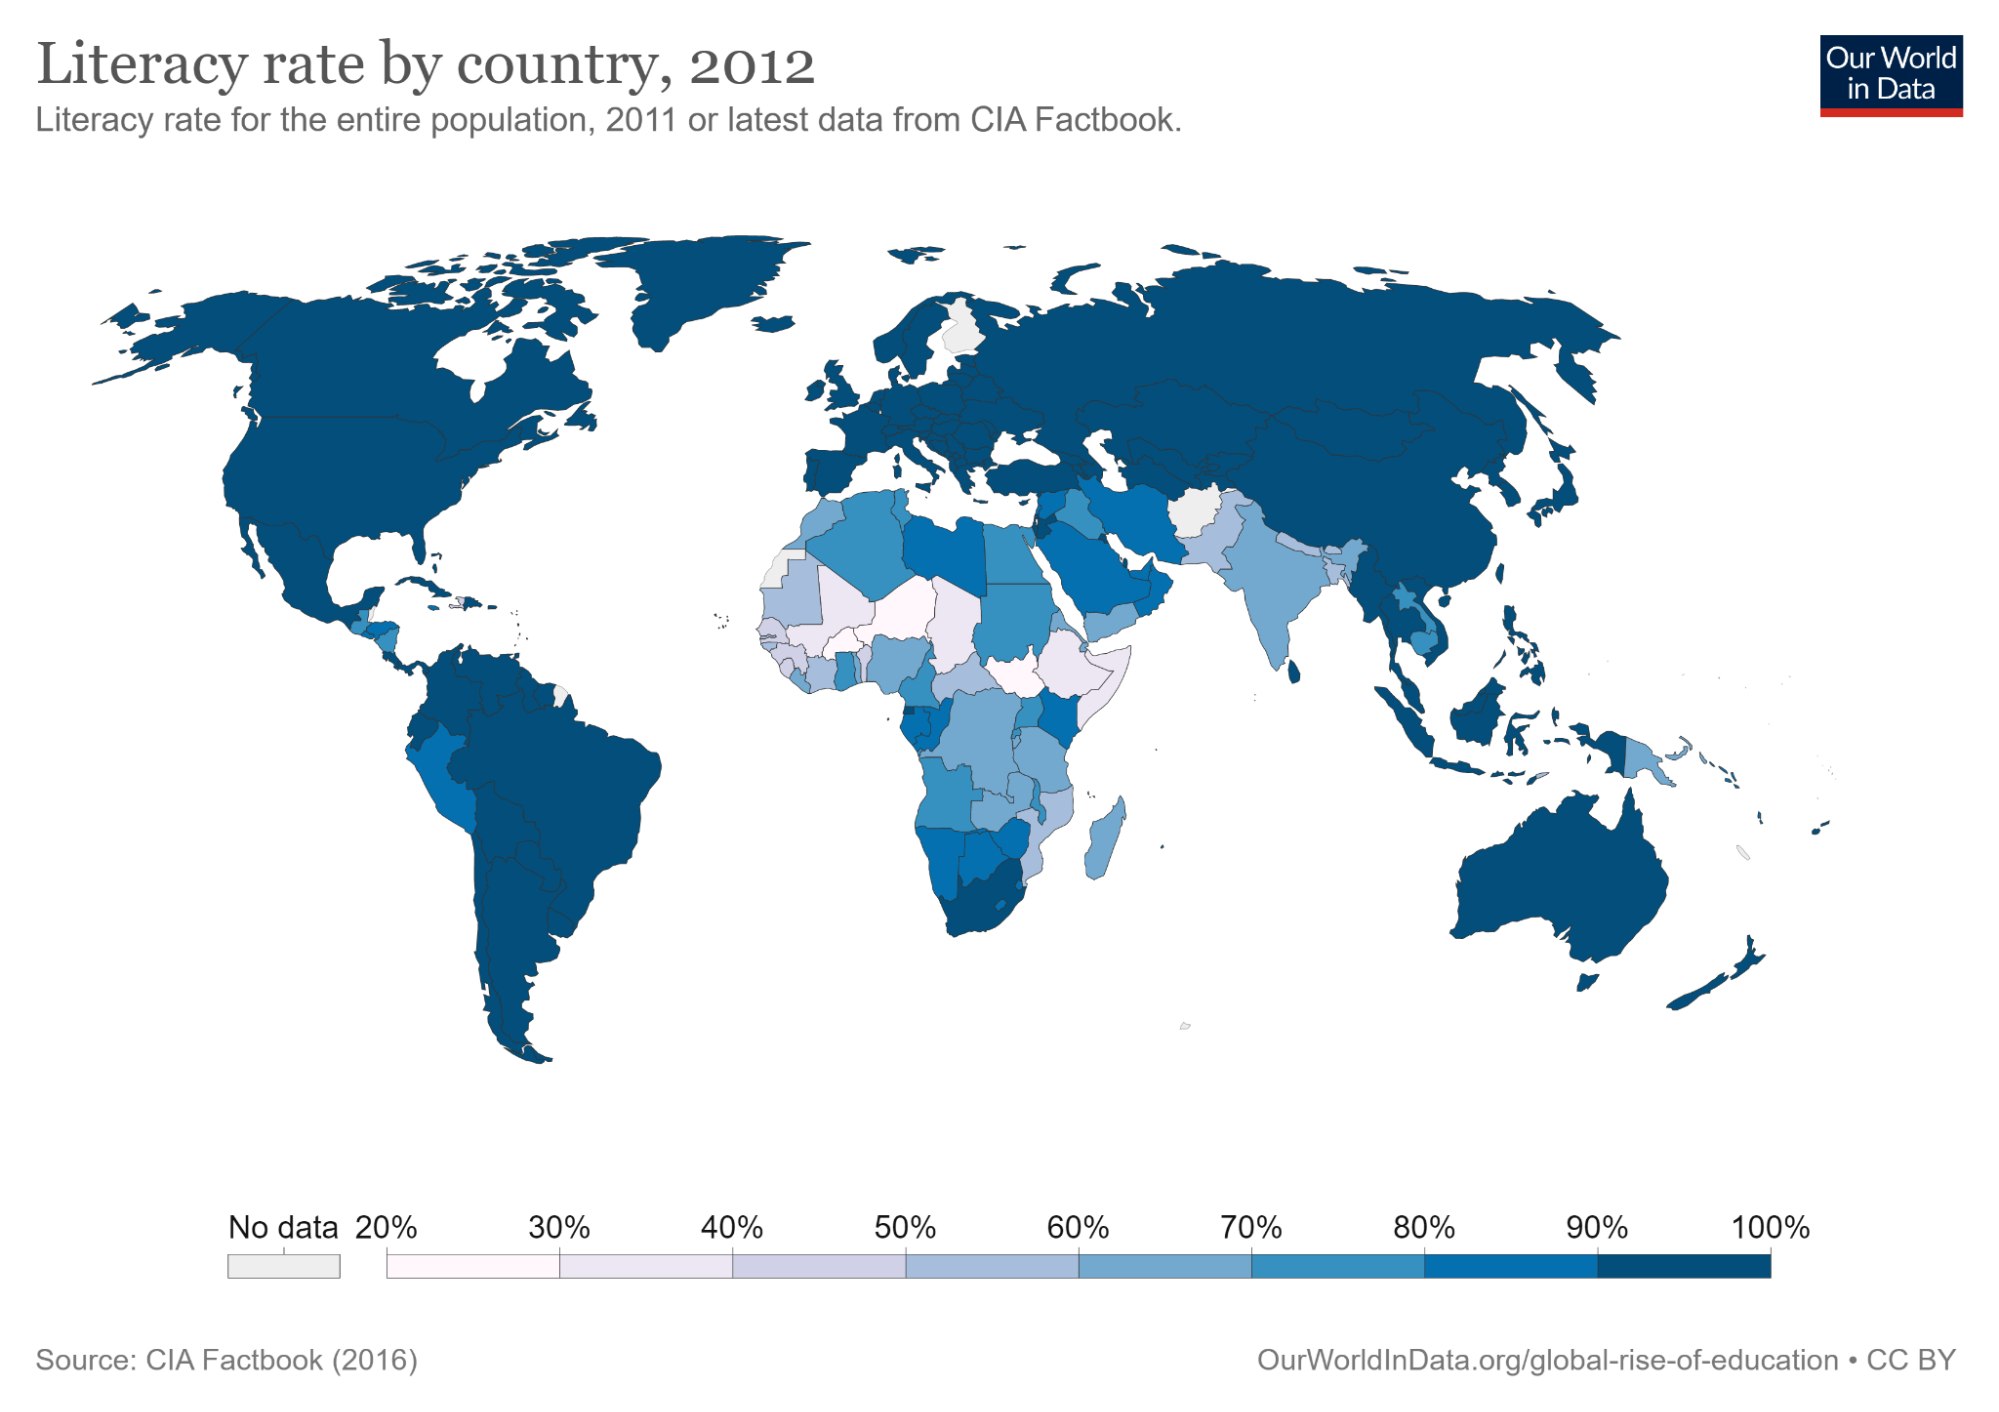
Figure 7.10. Literacy Rate by Country, 2012 Our World in Data
The most astonishing thing about the map in figure 7.10 is that most of the world’s population can read and write. As recently as 1940, most of the world’s population could not read and write. The speed of this change is astounding.
However, the differences between educational systems between countries is significant. Every nation in the world is equipped with some form of education system, though those systems vary greatly. The major factors that affect education systems are the resources and money that are utilized to support those systems in different nations. As you might expect, a country’s wealth has much to do with the amount of money spent on education. Countries that do not have such basic amenities as running water are unable to support robust education systems or, in many cases, any formal schooling at all. The result of this worldwide educational inequality is a social concern for many countries, including the United States.
International differences in education systems are not solely a financial issue. The value placed on education, the amount of time devoted to it, and the distribution of education within a country also play a role in those differences. For example, students in South Korea spend 220 days a year in school, compared to the 180 days a year of their United States counterparts (Pellissier 2010).
Then there is the issue of educational distribution and changes within a nation. The Program for International Student Assessment (PISA) is administered to samples of 15-year-old students worldwide. In 2010, the results showed that students in the United States had fallen from 15th to 25th in the rankings for science and math (National Public Radio 2010). The same program showed that by 2018, U.S. student achievement had remained on the same level for mathematics and science, but had shown improvements in reading. In 2018, about 4,000 students from about 200 high schools in the United States took the PISA test (OECD 2019).
Analysts determined that the nations and city-states at the top of the rankings had several things in common. For one, they had well-established standards for education with clear goals for all students. They also recruited teachers from the top 5 to 10 percent of university graduates each year, which is not the case for most countries (National Public Radio 2010).
Finally, there is the issue of social factors. One analyst from the Organization for Economic Cooperation and Development, the organization that created the PISA test, attributed 20 percent of performance differences and the United States’ low rankings to differences in social background. Researchers noted that educational resources, including money and quality teachers, are not distributed equitably in the United States. In the top-ranking countries, limited access to resources did not necessarily predict low performance. Analysts also noted what they described as “resilient students,” or those students who achieve at a higher level than one might expect given their social background. In Shanghai and Singapore, the proportion of resilient students is about 70 percent. In the United States, it is below 30 percent. These insights suggest that the United States’ educational system may be on a descending path that could detrimentally affect the country’s economy and its social landscape (National Public Radio 2010).
7.3.3 Going Deeper
If you want single variable views of inequality in education feel free to look at An Overview of Education in the United States.
7.3.4 Licenses and Attributions for Who Gets Educated?
“Who Gets Educated” by Kimberly Puttman is licensed under CC BY 4.0.
Kozol – Savage Inequalities
CC-BY-SA
https://socialsci.libretexts.org/Bookshelves/Sociology/Introduction_to_Sociology/Book%3A_Sociology_(Boundless)/13%3A_Education/13.02%3A_Education_and_Inequality/13.2A%3A_Savage_Inequalities – lightly edited
Differences between countries remixed from Text Sociology 3e https://openstax.org/books/introduction-sociology-3e/pages/16-1-education-around-the-world
Figure 7.9. Jonathan Kozol at Pomona College: Savage Inequalities, a 1991 book by Jonathan Kozol, examines the class- and race-based disparities in education. https://commons.wikimedia.org/wiki/File:Jonathan_Kozol_at_Pomona_College_17_April_2003.jpg
Figure 7.10. Global Education https://ourworldindata.org/global-education CC-BY
