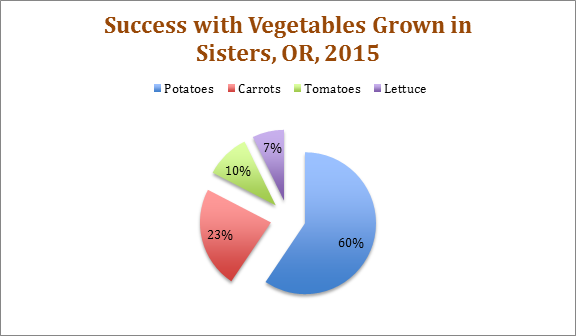
The first example below is a pie chart created with information the writer obtained from an interview. Notice that the writer provides a name for the visual, includes introductory sentences to provide context for the graphic, lists source information at the bottom of the chart, and finally, includes some closing remarks to tie it all together.
Not all gardeners will experience success with growing vegetables in Central Oregon, and the town of Sisters is especially challenging because of the varied temperatures all year long and the chance of frost or even freezing temperatures during any month of the year. Central Oregon and Sisters resident, Jane Doe, had the greatest success with the following vegetables in the year 2015 as noted in the pie chart below.
Table 1: Vegetables grown in 2015
Source: Interview with Master Gardener, Jane Doe, 2 May 2016.
It is important to note that depending on the hardiness zone of the city, some vegetables may do better than others. Doe also commented that she protected her tomatoes either inside a green house or under a hoop house.
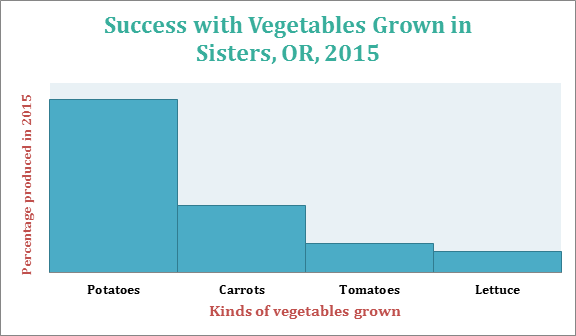
Below you will find another visual of the same information from the pie chart. It is provided to give you another way of visualizing the same information.
Figure 1: Vegetables grown in 2015
Source: Interview with Master Gardener, Jane Doe, 2 May 2016.
Finally, here is a simple table conveying information about plant hardiness zones for growers in Central Oregon. Notice again that the table isn’t simply inserted and left on its own for readers to interpret; the writer introduces the table with prefatory remarks and also provides follow-up commentary after the table.
The U.S. Department of Agriculture publishes a Plant Hardiness Zone Map which growers and gardeners use to help determine which plants, including vegetables and trees, will be most successful at a particular location. The table below shows the hardiness zone for four cities in Central Oregon and includes the annual minimum winter temperature—important information to keep in mind when determining not only which vegetables to plant but how long the growing season may be.
Table 1: Hardiness Zones in Central Oregon
Central Oregon City
Hardiness Zone
Winter Temperature Range
Sisters
6a
-10 to -5 (Fahrenheit)
Bend
6b
-5 to 0 (Fahrenheit)
Redmond
6b
-5 to 0 (Fahrenheit)
Tumalo
6b
-5 to 0 (Fahrenheit)
Source information: “United States Department of Agriculture.” USDA Plant Hardiness Zone Map. 2012. Web. 05 May 2016.
Before purchasing any plants or vegetables for your own garden, make sure you look at the hardiness number on the label to be sure that item will grow successfully in your climate zone.
Chapter Attribution Information
This chapter was derived by Annemarie Hamlin, Chris Rubio, and Michele DeSilva, Central Oregon Community College, from Online Technical Writing by David McMurrey – CC: BY 4.0