
4.7 Social Patterns of Poverty
More than one out of ten Americans (10.5%) lives in poverty (U.S. Census Bureau, 2020). Despite the belief some maintain that poverty is due to poor choices made by many individuals, research suggests that these are the most common ways people end up living in poverty:
- Earnings of head of household dropped (42.8%)
- Married couple splits up (12.6%)
- Second income dropped (12.0%)
- Child moves out and forms a new family (11.3%)
- Other changes in the makeup of the family (10.9%)
- Birth (born into a poor family) (8.9%) (Blank, 2009)
4.7.1 The Intersectionality of Poverty
Some populations are more affected by poverty than others. These populations carry a higher risk of ending up poor due to structural and societal factors that create greater difficulties in reaching economic self-sufficiency. Members of groups that have been marginalized by society at any time are at a greater risk of additional oppression and access to the means to make a better life. Within intersectional frameworks, race, class, gender, sexuality, age, ability, and other aspects of identity are experienced simultaneously and the meanings of each identity overlaps with and influences the others, which is called intersectionality. In the 1960’s Black women protested that the feminist movement did not fully include the challenges faced by women who were people of color, and Kimberle Crenshaw pictured in figure 4.8 is known for coining this term.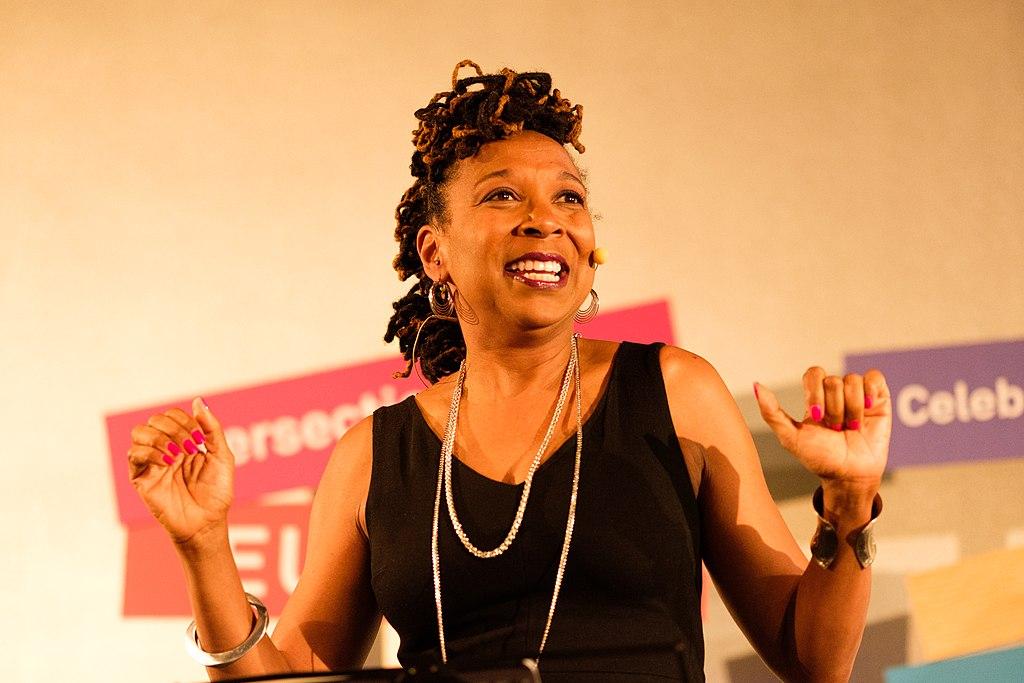
Figure 4.8. Articulated by legal scholar Kimberlé Crenshaw, the concept of intersectionality recognizes that the interaction of our social identities affect one another and that being members of multiple groups that have been marginalized contributes to the likelihood of facing stigma and discrimination.
By no means is being a member of one of these groups a sentence to a destitute life, but it does mean for a tougher road in a lot of cases. If someone is a member of more than one of the following groups, that increases their risk even more.
4.7.1.1 Women
The gap between male and female poverty in America is greater than any other country in the Western Hemisphere; over half our nation’s total poor population are adult women. Worldwide, 70% of the most impoverished people are also adult women (Cawthorne, 2008; Lefton, 2013).
The Center for American Progress notes the following economic challenges faced by women:
- Women are more often employed in lower-paying fields and are encouraged to pursue careers in such fields more than lucrative careers;
- Although most poor women are childless, when parents split up, women take on a disproportionate amount of the economic burden of child care, if not all of it;
- Pregnancy affects women’s work more than men’s, as they are often forced to take more time off or cut hours without being compensated for the lost time;
- Domestic and sexual violence are far bigger risk factors for women, and two major causes of houselessness, as well as risk factors for losing one’s job (Davis, 2006).
One reason that women are more poor than men is that they consistently earn lower salaries than men, even when working comparable full-time hours, as shown over time in figure 4.9.

Figure 4.9. While the gender pay gap is not as large as it was in 1960, it continues today. Figure 4.9 Image Description
Since poor women more often saddled with child care duties or expenses than poor men, and most employers do not provide child care benefits, women often have to make a difficult choice: work, spend very little time with their kids, and spend a large portion of their earnings on the child care they need only because they are working. The other option is to stay home and spend time with their children while they still can, but become reliant on government benefits. In this case they typically enjoy an equal or even improved quality of life compared to the money they’d have left over from their job after paying for child care (Dáil, 2012).
4.7.1.2 Single-Parent Families
Over a quarter (27%) of single-parent families live in poverty compared to 16% of two-parent families (Livingston, 2018). The risk is unsurprisingly higher for families headed by single moms. While 37% of families led by a single mother are below the poverty line, 18% of single father-headed families are below the same line as shown in Figure 4.10 (U.S. Census, 2020).
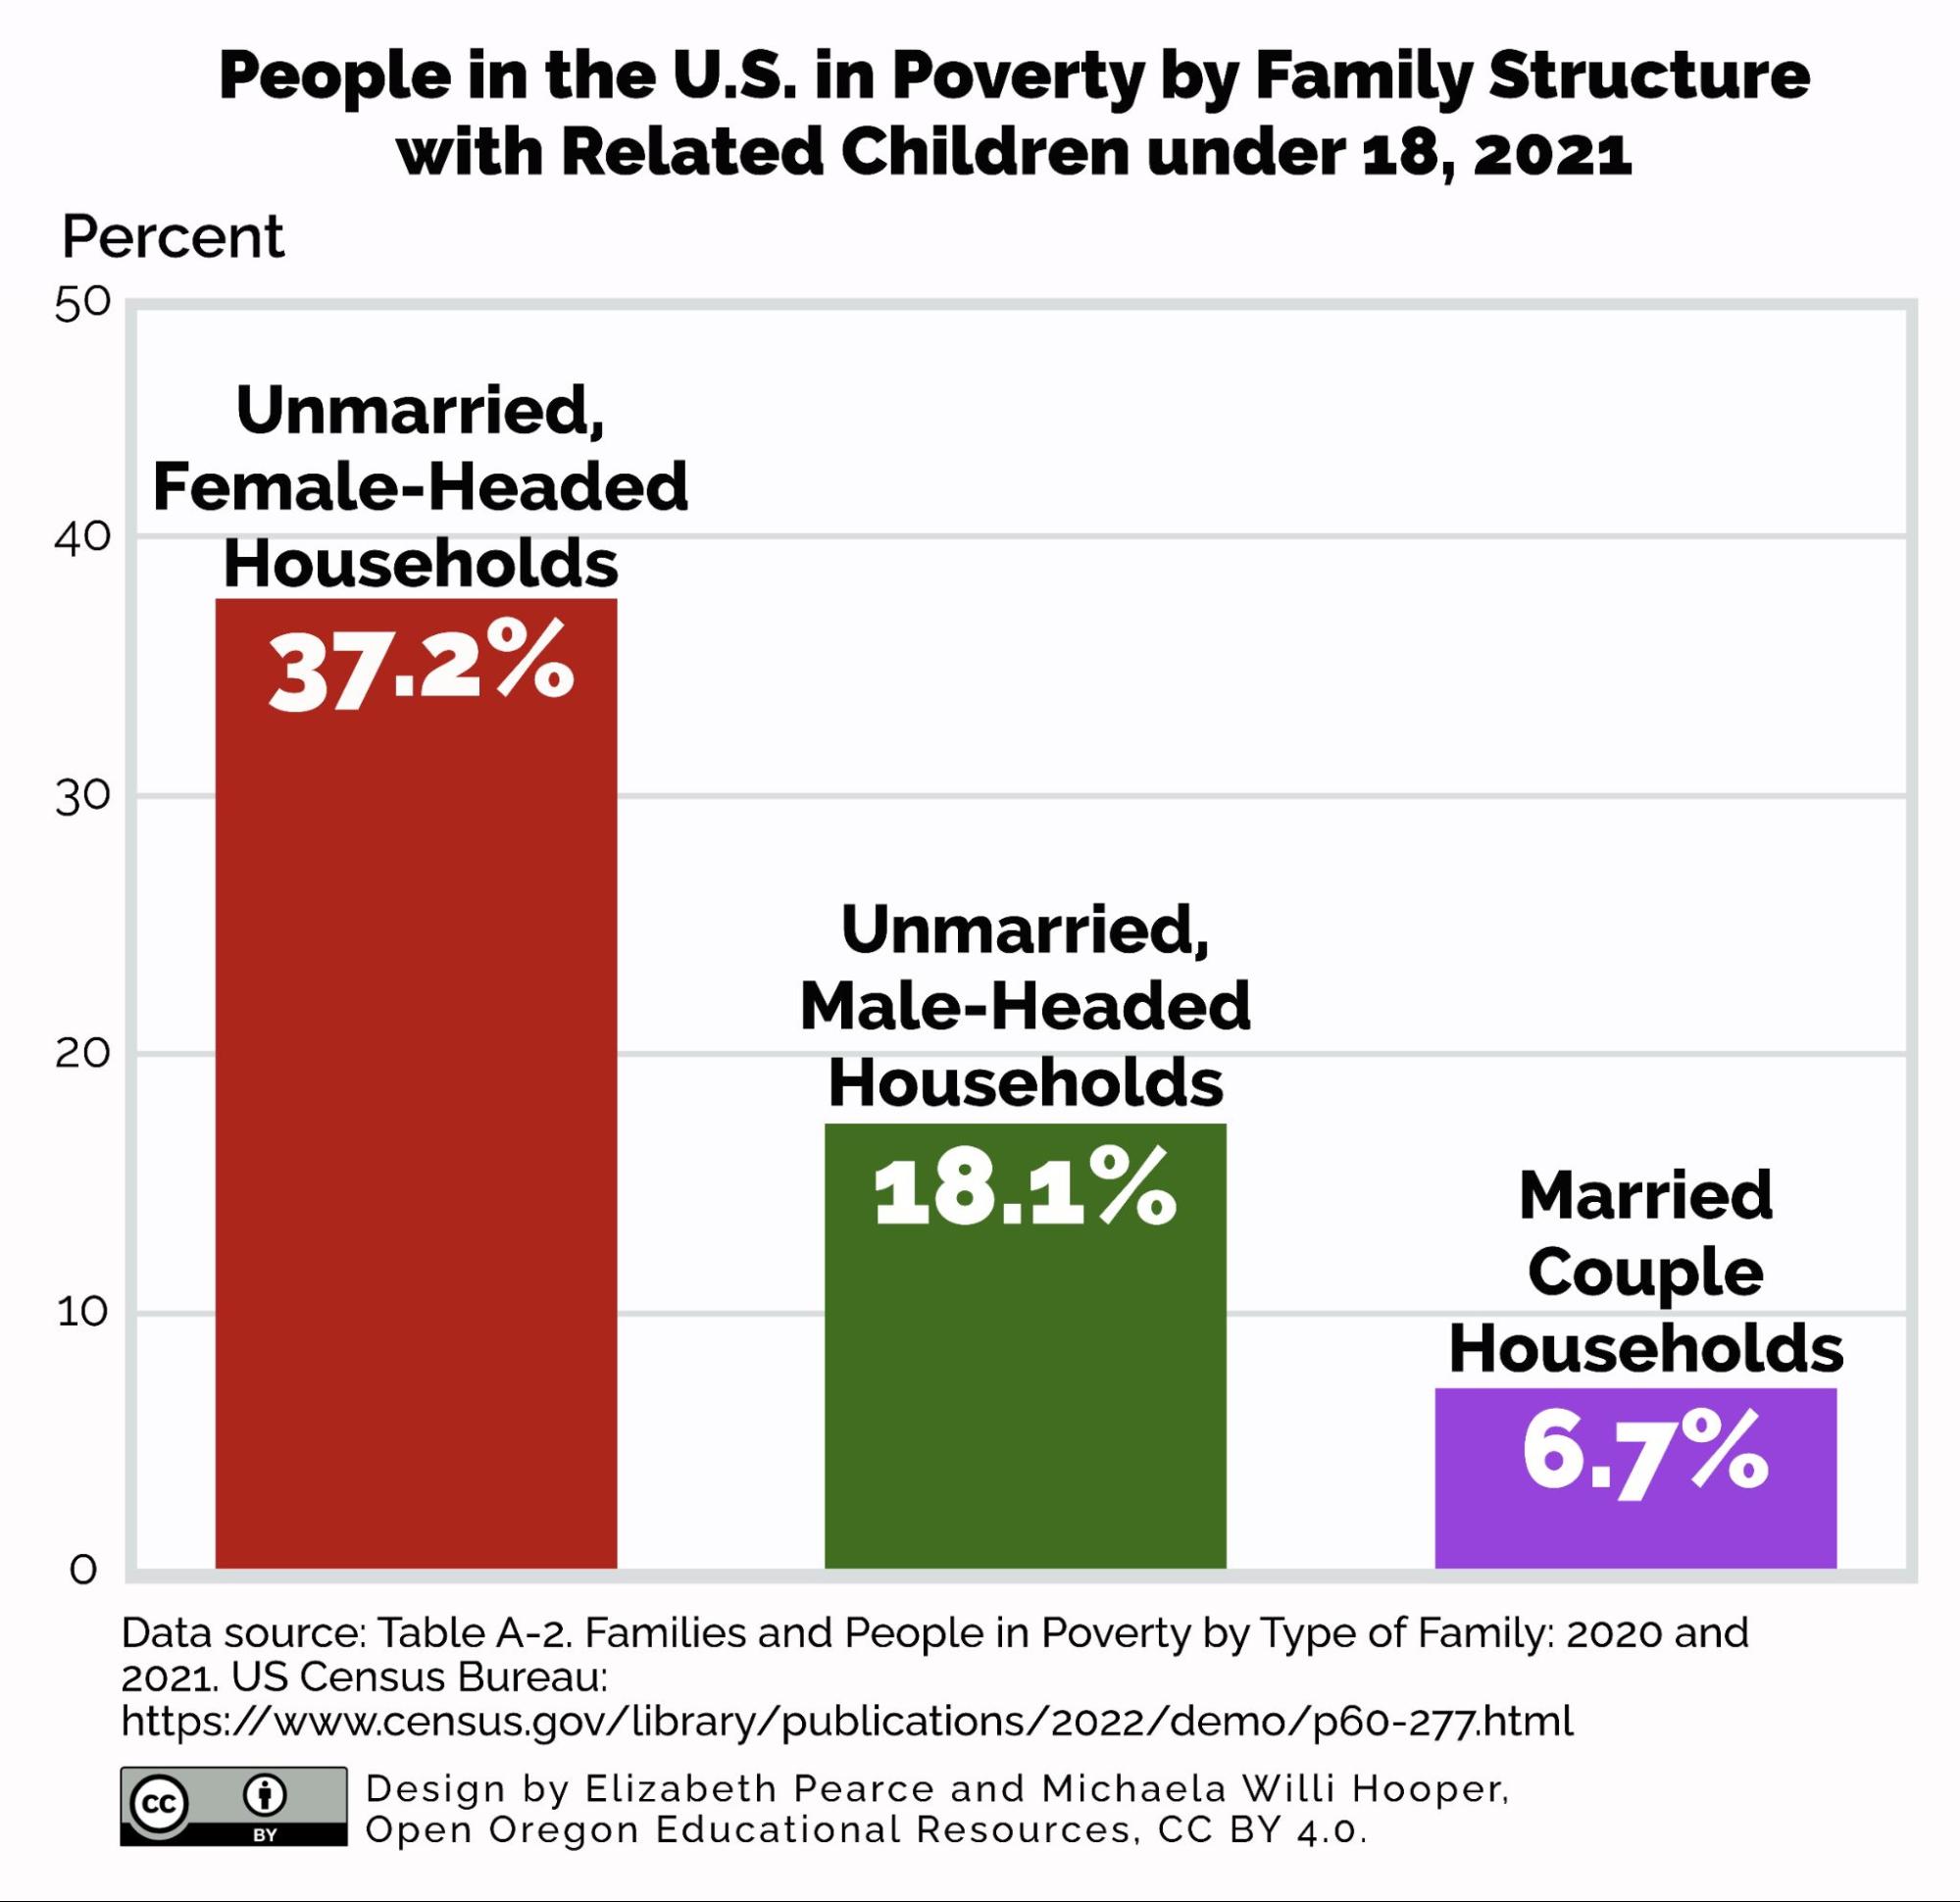
Figure 4.10. Children who live with woman-headed families are much more likely to be poor than those living with man-headed families. Figure 4.10 Image Description
4.7.1.3 Older Adults
Though the percentage of elderly who are poor has fallen over the last few decades, the number of elderly people in poverty has actually grown as our older adult population has been undergoing considerable growth (as you will read in Chapter Seven). Their ability to stay out of poverty is largely due to benefits paid out through Social Security, which average close to $1,550 per month (Social Security Administration, 2021a). Without those benefits, nearly 45% of elderly people would be below the poverty line; with it, only 9.1% are (Van de Water, Sherman, & Ruffing, 2013).
4.7.1.4 People of Color
Data show that poverty and race are linked. Not only are people of color more likely to be below the poverty line, they are more likely to stay there for a longer period of time (Blank, 2009). According to the U. S. Census Bureau statistics of 2010, 22% of Black families and 21.3% of Hispanic families were poor, compared to 9.8% of Asian-American families and 8.4% of white families. Despite the lower rate of poverty among whites, the number of White families in poverty (approximately 5.4 million) still exceeds the number of poor Black and Hispanic families combined (4.3 million) (U.S. Census Bureau, 2010).
When the economy is suffering, people of color also find themselves disproportionately impacted. This gap exists between Blacks and Whites of similar educational levels as well, at each level measured:
- High school diploma: 22.5% Black unemployment, 13.9% White unemployment
- Some college: 12.4% Black unemployment, 7.6% White unemployment
- Bachelor’s degree or higher: 7.9% Black unemployment, 4.3% White unemployment (Martin, 2013).
The trends over time, including data from the U.S. Census of 2020, shows that while median income continues to increase for all groups, the stratification by race still exists (Figure 4.11).

Figure 4.11. Asian and White people still have the highest median incomes in the United States. Figure 4.11 Image Description
Although not separately addressed in the Census data we’ve discussed, it is noteworthy that Native Americans and Alaskan natives have long been suffering disproportionately from poverty as well. Every Census year from 1970-2000, the percentage of Native Americans and Alaskan natives living in poverty on reservations was at least double the rate of the American population in general (Dewees & Foxworth, 2013); though this improved with the 2010 Census, there is still a large gap. Over 28% of Native Americans fell below the poverty line, as compared to 15.3% of the United States as a whole (U.S. Census Bureau, 2011).
4.7.1.5 People with Disabilities
Many people have seen an unhoused person with an apparent disability on the street and felt something stir within them, perhaps giving them a dollar or two as they passed by. People with disabilities are more likely to be chronically homeless than other groups (Hombs, 2011). An estimated 28.4% of adults with disabilities (aged 21-64) who were not housed in institutions in 2012 fell below the poverty line (Erickson, Lee, & von Schrader, 2014). Having a disability is a major risk factor for poverty, nearly doubling one’s chances of being poor (figure 4.9).
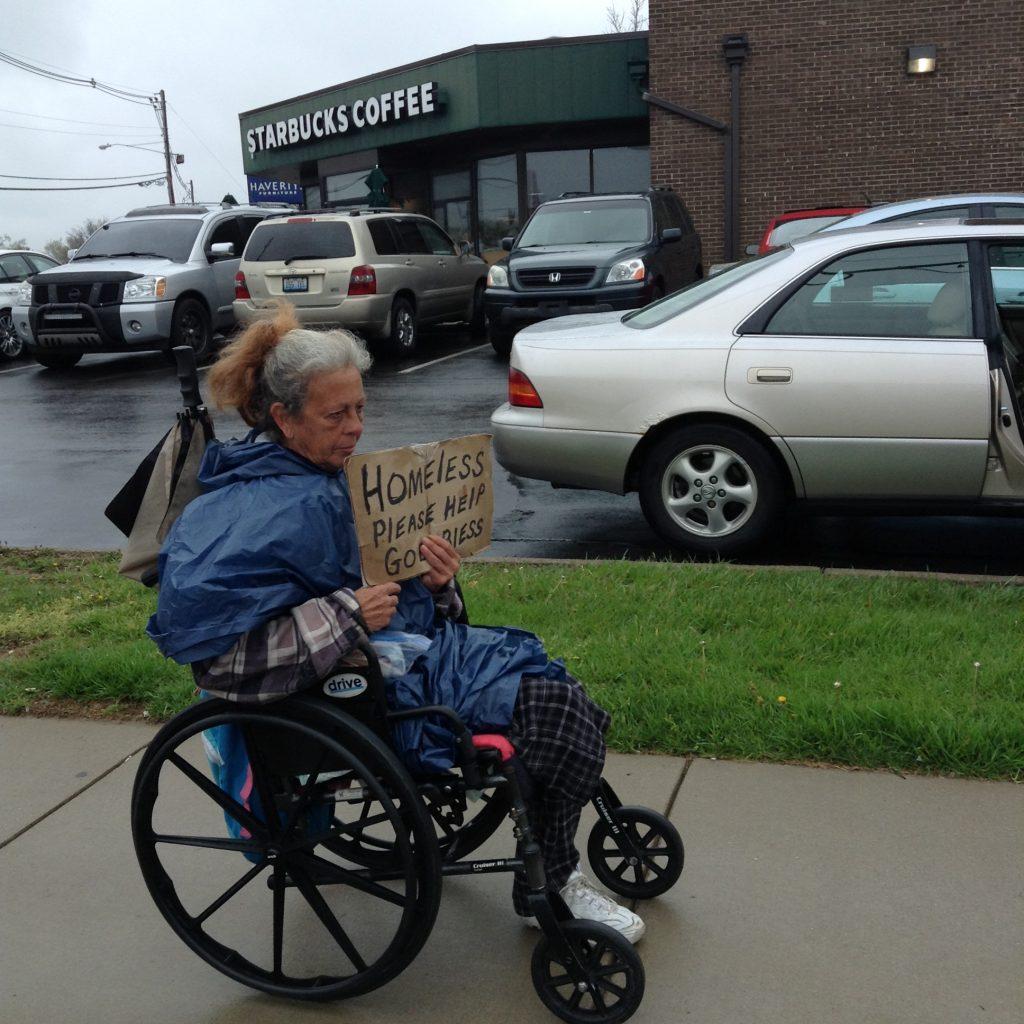
Figure 4.12. The houseless population in the US grew dramatically during the COVID-19 pandemic.
4.7.1.6 LGBTQ+ People
In general annual earnings are lower for LGBTQ+ households, with lesbian households having the lowest earnings compared to gay householes and heterosexual households (Martell, 2013, p. 261). Many studies have shown that while lesbian women appear to earn slightly more than heterosexual women, gay men earn less than heterosexual men (Martell, 2013). Social stigma and the lack of legal recognition of marriage (until very recently, 2015) likely contribute to this discrepancy.
Considerable evidence shows that discrimination plays a part in the wage differentials of LGBTQ+ workers and heterosexual cisgender workers (Martell, 2013). Until 2021, in most states, LGBTQ+ people could be fired simply on the basis of sexual orientation or gender identity, irrespective of their talents or job performance. One recent study found that nearly “30 percent of bisexual women and 23 percent of lesbian[s]” were below the poverty line, compared with 21% of all American women (Caiazza, 2015). The news was even worse for trans women, who are four times as likely as other Americans to be living on $10,000 or less per year (Caiazza, 2015).
4.7.1.7 Children
Being a child puts one at greater risk for poverty; kids are the highest-risk age group for poverty in America. Children may be part of any of the groups described above (e.g. female, nonwhite, disabled) but they also have the least power and fewest rights of any group. The larger a family gets (i.e., the more kids in a family), the greater the risk. Families with five kids are more likely to be poor than families with two, simply because there are fewer resources to go around. The chance of being poor decreases as age increases; about one-fifth of kids under age 5 are poor, compared to about one-seventh of children overall. Nearly three-quarters of all poor children are racial minorities (Reese, 2005; Children’s Defense Fund, 2021).
In fact, America has the highest child poverty rate of any industrialized nation in the world—this is likely due in part to the fact that many other advanced countries provide “universal allowances, national health insurance” (typically more comprehensive than the Affordable Care Act), “subsidized child care, and paid family leave” (Reese, 2005, p. 199). The 2020 Census affirmed that children are still in poverty in large numbers, as illustrated in Figure 10.13. Additionally, half of all poor children live in extreme poverty–in households where the income is less than half of the poverty line (Children’s Defense Fund, 2021).
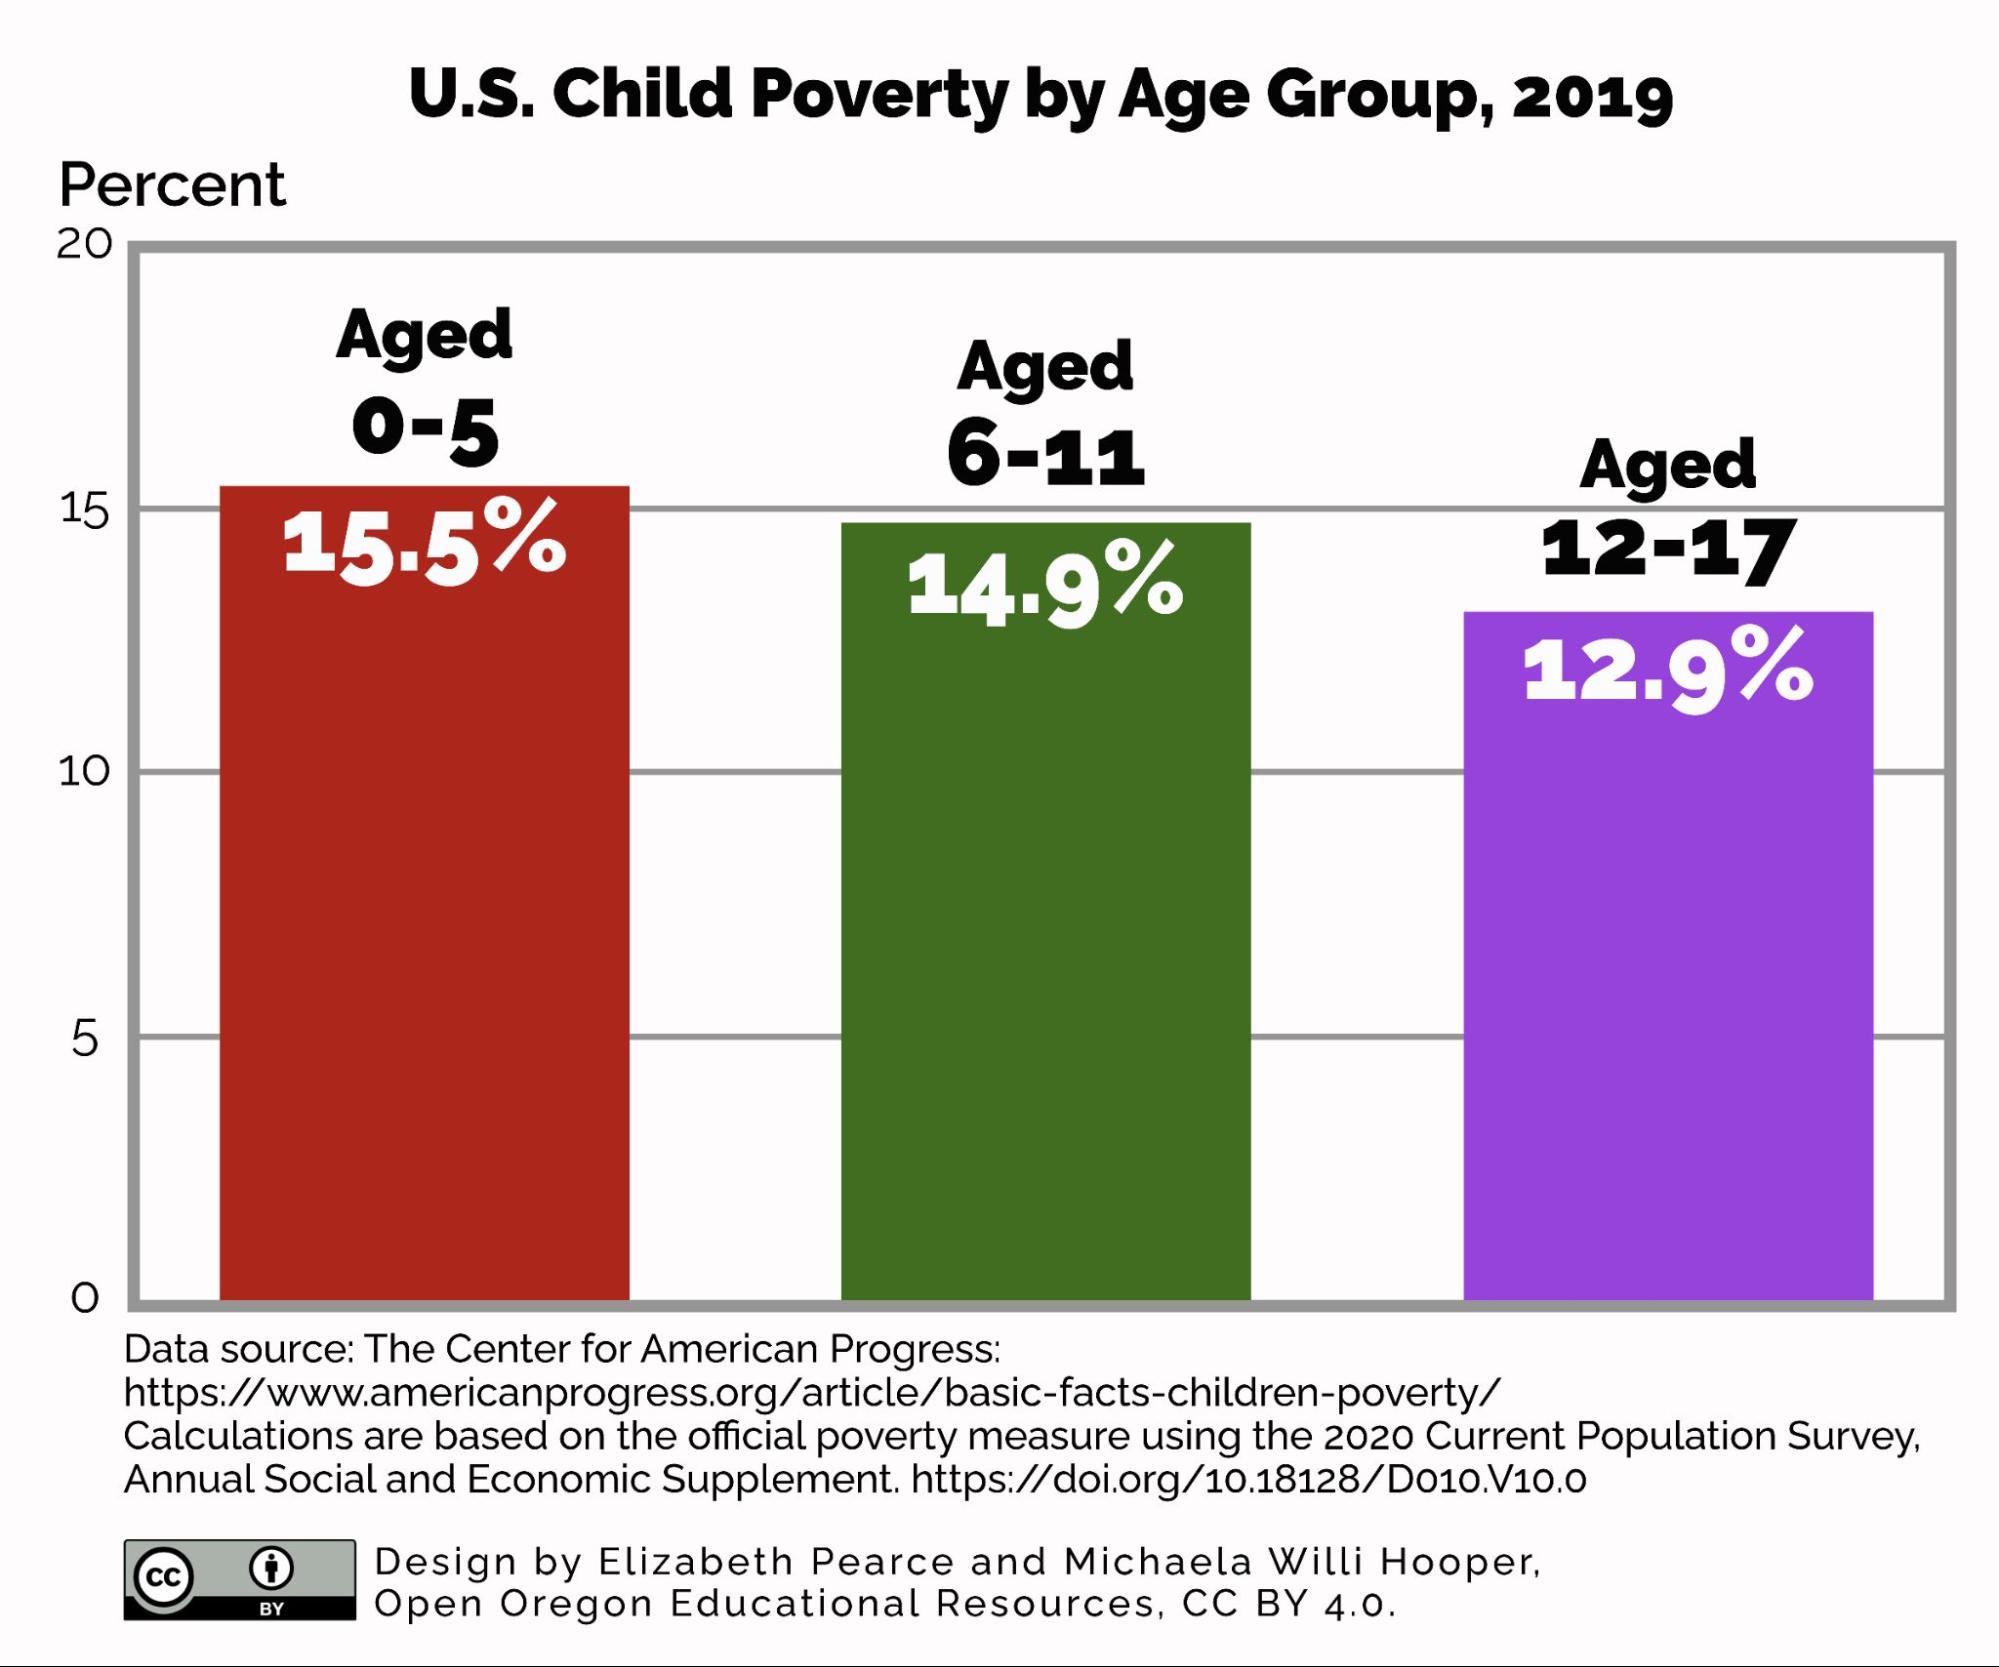
Figure 4.13. Children in the United States continue to be poor in larger percentages than adults. Figure 4.13 Image Description
Nearly one in five children in America lives in a poor household, which can make healthy eating a struggle, leading to potential health problems down the line.
4.7.2 Impacts of Poverty
Poverty’s primary harmful effects are economic, but economic struggles bring about many other problems. Following are several common problems that overlap with poverty; human services professionals are likely to interact with individuals experiencing one or more of these problems.
4.7.2.1 Houselessness
In 2019, over a half million Americans were considered houseless. Commonly referred to as “the homeless” or “homeless people” in the past, “unhoused” and “people who are houseless” are now considered to be more respectful and more accurate. This encompasses the movement toward “person-first language” as well as the distinctions between a house, which refers to a physical shelter, and a home that includes both shelter as well as family, loved ones, or other comforts. Many of the people lacking housing are children and youth. In early 2018, just over 180,000 people in 56,000 families with children experienced houselessness. More than 36,000 young people (under the age of 25) were unaccompanied youth who were houseless on their own; most of those (89%) were between the ages of 18 and 24 years (U.S. Department of Housing and Urban Development. (2018).
These recent statistics were collected for Oregon (2019):
- Total Houseless Population: 14,655
- Total Family Households Experiencing Houselessness: 825
- Veterans Experiencing Houselessness: 1,329
- Persons Experiencing Chronic Houselessness: 4,339
- Unaccompanied Young Adults (Aged 18-24) Experiencing Houselessness: 1,314
- Total Number of Houseless Students: 23,765
- Total Number of Unaccompanied Houseless Students: 3,699
- Nighttime Residence, Unsheltered: 1,094
- Nighttime Residence: Shelters: 1,824
There has been a slight decrease in houselessness in Oregon in all of the above categories, with the exception of the number of houseless students, which increased between 2018 and 2019 (Homeless in Oregon statistics 2019.)
Housing insecurity is less transparent than houselessness. People who are houseless are somewhat visible, but we may be less likely to know whether or not someone is housing insecure. That’s because it is an umbrella term that encompasses many characteristics and conditions. Signs of housing insecurity include missing a rent or utility payment, having a place to live but not having certainty about meeting basic needs, experiencing formal or informal evictions, foreclosures, couch surfing, and frequent moves (Office of Policy Development and Research. US Department of Housing and Urban Development. (n.d.). It can also include being exposed to health and safety risks such as mold, vermin, and lead, overcrowding, and personal safety fears such as abuse (Healthy People 2020. Office of Disease Prevention and Health Promotion. (n.d.).
Housing insecurity can be defined as a social problem; the current estimates are that 10-15% of all Americans are housing insecure. The increase in the number of cost-burdened households, households that pay 30% or more of monthly income toward housing, is dramatic amongst families who rent homes. Since 2008, these households increased by 3.6 billion to include 21.3 billion by 2014. And households with the most severe cost burden (paying 50% or more for housing) increased to a record 11.4 million(Joint Center for Housing Studies, Harvard University. (2016). By definition, a cost-burdened household is one that also faces housing instability and insecurity.
Houselessness brings with it a myriad of problems that add to the misery of poverty. houseless people are more likely to be victimized by crime (Fish, 2014); more likely to suffer from untreated health problems; more likely to suffer from mental disorders (20-25% compared to 4% of all Americans); and have a much shorter life expectancy—42 to 52 years, as opposed to 78 for the general population (Ambrosino, Heffernan, Shuttlesworth, & Ambrosino, 2012; National Coalition for the Homeless, 2009). Furthermore, it is very difficult for homeless individuals to get a job, as they have a harder time finding a way to look presentable for interviews, have no address to put on an employment application, and likely have no phone where a prospective employer can reach them. This makes escaping from houselessness, and poverty, all the more difficult.
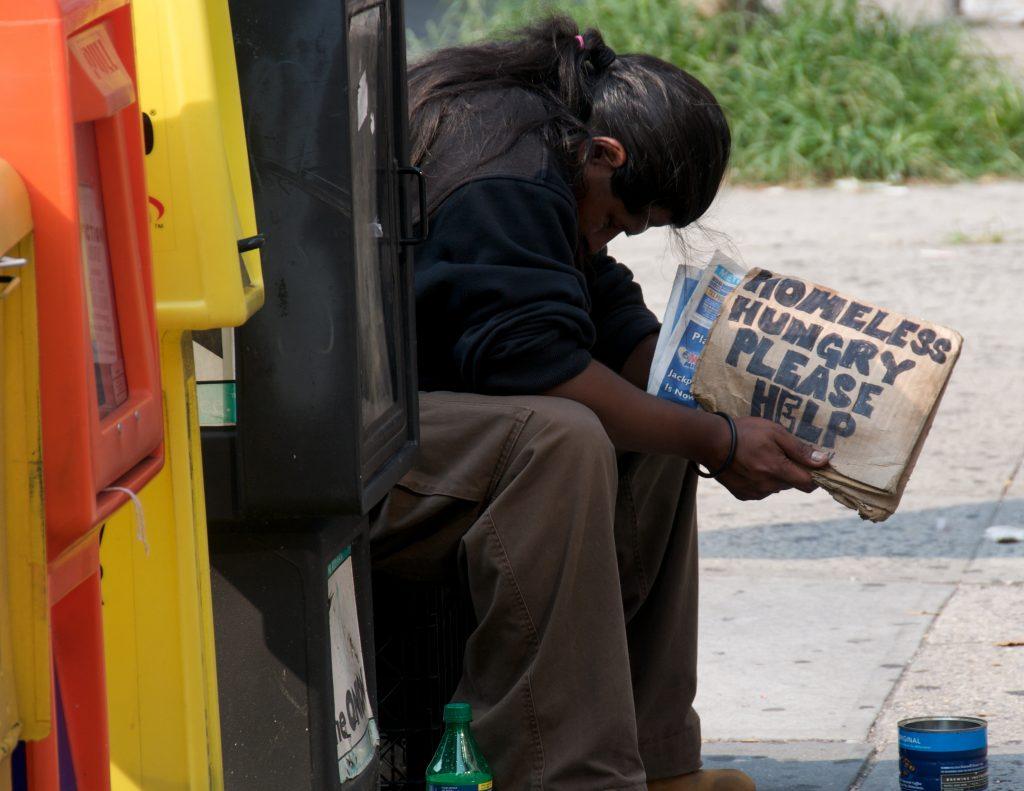
Figure 4.14. Surviving day to day is a significant enough challenge for people who are homeless. More cities in recent years have even been criminalizing the act of feeding homeless individuals in public.
4.7.2.2 Mental and physical health
Poverty impacts the quality of health care one can receive. Poor individuals are often uninsured or underinsured. If they can qualify for Medicaid or a state health care plan, such as the Oregon Health Plan (OHP), that is much better. However, many adults in need do not receive these benefits and are forced to get whatever affordable healthcare they can or to resort to emergency rooms.
Not only can poor health and high medical expenses lead to houselessness, but houselessness can certainly harm one’s health. Compared to people with a household income of $70,000 or more, those with an income below $19,000 have significantly higher risk of developing depression, an anxiety disorder, or a substance use disorder during their lifetimes (Mossakowski & Gibson, 2013). Poverty is also strongly linked with higher risk of AIDS and other sexually transmitted infection transmission (Kposowa, 2013).
4.7.2.3 Education
Many schools in the United States are funded largely by local property taxes, which means that school districts with more expensive land and wealthier residents get more tax revenue to build their facilities, hire the best teachers, and train their administrators, support staff, and educators to do the best job possible. Meanwhile, schools in low-income areas have to make do with teachers that will take lower-paying positions, sometimes using textbooks that are outdated. This puts the poorer students in more cash-strapped school districts at an even greater disadvantage than they were before school.
Children in poverty are also less likely to stay in school, in part because they find it irrelevant, tedious, and devaluing of their humanity (Brown, 2015). Although kids from poor households are more likely to be truant, nearly a quarter of poor kids were frequently missing school in order to care for a sick relative at home; 30% were “bullied so severely they were too scared to return to school”; and nearly half succumbed to peer pressure to skip classes (Brown, 2015, p. 24-25).
As if that were not enough, students who live in poverty are already educationally disadvantaged before they even get to kindergarten. Those socioeconomic differences that have them on unequal footing as they start school only widen over the course of their education. (Ansalone, 2009, p. 34).
Review the data in figure 4.15. You will notice that the hours being read to and the accumulated experience with words may impact a child’s school readiness. What factors might get in the way of parents in poverty having time to read to their children?
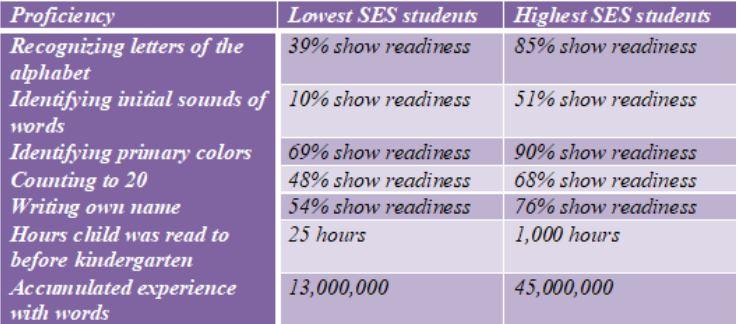
Figure 4.15. Beginning Kindergarten Students’ School Readiness Skills by Socioeconomic Status (SES); (Neuman, 2009, p. 19)
4.7.3 References
Ambrosino, R., Heffernan, J., Shuttlesworth, G., & Ambrosino, R. (2012). Social work and social welfare: an introduction. Brooks/Cole Cengage Learning.
Ansalone, G. (2009). Exploring unequal achievement in the schools: The social construction of failure. Lexington Books.
Blank, R. (2009). The changing face of poverty. In J. Manza & M. Sauder (Eds.), Inequality and society: Social science perspectives on social stratification, pp. 279-295.
Brown, C. (2015). Educational binds of poverty: The lives of school children. Routledge.
Caiazza, T. (2015). Release: LGBT women are among most at risk of poverty in America. Center for American Progress. https://www.americanprogress.org/press/release/2015/03/13/108650/release-lgbt-women-are-among-most-at-risk-of-poverty-in-america/.
Cawthorne, A. (2008, October 8). The straight facts on women in poverty. Center for American Progress. https://www.americanprogress.org/issues/women/report/2008/10/08/5103/the-straight-facts-on-women-in-poverty/.
Children’s Defense Fund (2021). The state of America’s children 2021. https://www.childrensdefense.org/state-of-americas-children/soac-2021-child-poverty/
Dáil, P. W. (2012). Women and poverty in 21st century America. McFarland & Company.
Davis, D. (2006). Battered black women and welfare reform: Between a rock and a hard place. State University of New York Press.
Dewees, Sarah and Foxworth, Richard. The economics of inequality, poverty, and discrimination in the 21st Century. https://iucat.iu.edu/iuk/12186917
Erickson, W., Lee, C., von Schrader, S. (2014). Disability Statistics from the 2012 American Community Survey (ACS). Cornell University Employment and Disability Institute (EDI). http://www.disabilitystatistics.org.
Fish, S. (2014, August 25). Violence grows against the homeless, sparking push for hate crime status. Al Jazeera America. http://america.aljazeera.com/articles/2014/8/25/violence-againsthomeless.html.
Healthy People 2020. Office of Disease Prevention and Health Promotion. (n.d.). Housing instability. https://www.healthypeople.gov/2020/topics-objectives/topic/social-determinants-health/interventions-resources/housing-instability
Hombs, M. E. (2011). Modern houselessness. ABC-CLIO.
Homeless in Oregon statistics 2019. Homeless estimation by state | us interagency council on houselessness. (n.d.). Retrieved August 22, 2022, from https://www.usich.gov/houselessness-statistics/or/
Joint Center for Housing Studies, Harvard University. (2016, June 22). The state of the nation’s housing 2016. https://www.jchs.harvard.edu/research-areas/reports/state-nations-housing-2016
Kahn, P. (2013). Oral health and poverty. In K. M. Fitzpatrick (Ed.), Poverty and health: A crisis among America’s most vulnerable. Volume 1: Risks and challenges, pp. 55-88. Praeger.
Kposowa, A. J. (2013). Poverty, HIV, and sexually transmitted diseases. In K. M. Fitzpatrick (Ed.), Poverty and health: A crisis among America’s most vulnerable. Volume 1: Risks and challenges, pp. 89-104. Praeger.
Livingston, G. (2018). The changing profile of unmarried parents. Pew Research Center. https://www.pewresearch.org/social-trends/2018/04/25/the-changing-profile-of-unmarried-parents/.
Martell, M. E. (2013). Are gays and lesbians “mainstream” with respect to economic success? In R. S. Rycroft (Ed.), The economics of inequality, poverty, and discrimination in the 21st century, pp. 254-271. Praeger.
Martin, L. L. (2013). Black asset poverty and the enduring racial divide. FirstForumPress.
National Alliance to End houselessness (2021).State of houselessness: 2021 edition. https://endhouselessness.org/houselessness-in-america/houselessness-statistics/state-of-houselessness-2021/.
National Coalition for the Homeless (2009). Health care and houselessness. http://www.nationalhomeless.org/factsheets/health.html.
Neuman, S. B. (2009). Changing the odds for children at risk: Seven essential principles of educational programs that break the cycle of poverty. Teachers College Press.
Office of Policy Development and Research. US Department of Housing and Urban Development. (n.d.). Measuring housing insecurity in the American housing survey. PD&R Edge Magazine. https://www.huduser.gov/portal/pdredge/pdr-edge-frm-asst-sec-111918.html
Reese, E. (2005). Backlash against welfare mothers: Past and present. University of California Press.
Segal, E. A., Gerdes, K. E., & Steiner, S. (2013). An introduction to the profession of social work: Becoming a change agent (4th ed.). Brooks/Cole Cengage Learning.
U.S. Department of Housing and Urban Development. (2018, December). The 2018 annual homeless assessment report to Congress. https://files.hudexchange.info/resources/documents/2018-AHAR-Part-1.pdf
4.7.4 Licenses and Attributions for Social Patterns of Poverty
4.7.4.1 Open Content Shared Previously
“Social Patterns of Poverty” is adapted from “Poverty and Financial Assistance” by Mick Cullen and Matthew Cullen, Social Work and Social Welfare and is licensed under CC BY-NC-SA 4.0. Adaptations by Elizabeth B. Pearce include light editing, vocabulary and context changes to adapt for the human services field, and the addition of a section on Intersectionality.
Figure 4.8. “Kimberlé Crenshaw” by Mohamed Badarne. License: CC BY-SA 4.0.
.jpg)
Figure 4.12. “Robin Wathen – Part 1” by EX22218 – ON/OFF is licensed under CC BY-NC-ND 2.0.
Figure 4.14. “Still hungry. Still homeless. Still need help.” by Ed Yourdon is licensed under CC BY-NC-SA 2.0.
4.7.4.2 Open Content, Original
Figure 4.9. “Median Annual Earnings by Sex, 1960-2021” by Elizabeth Pearce and Michaela Willi Hooper, Open Oregon Educational Resources, is licensed under CC BY 4.0. Data from U.S. Census Bureau, Current Population Survey, Annual Social and Economic Supplements, 1960-2022; U.S. Department of Labor, Women’s Bureau.
Figure 4.10. “People in the U.S. in Poverty by Family Structure with Related Children under 18, 2021” by Elizabeth Pearce and Michaela Willi Hooper, Open Oregon Educational Resources, is licensed under CC BY 4.0. Data from Table A-2. Families and People in Poverty by Type of Family: 2020 and 2021. US Census Bureau.
Figure 4.11. “Real Median Income by Race and Hispanic Origin, 1967-2021” by Elizabeth Pearce, Jennifer Puentes, and Michaela Willi Hooper, Open Oregon Educational Resources, is licensed under CC BY 4.0. Adapted from “Real Median Household Income by Race and Hispanic Origin: 1967 to 2021.” Data from U.S. Census Bureau, Current Population Survey, 1968-2022. Annual Social and Economic Supplements.
Figure 4.13. “US Child Poverty Rate by Age Group, 2019” by Elizabeth Pearce and Michaela Willi Hooper, Open Oregon Educational Resources, is licensed under CC BY 4.0. Data from The Center for American Progress. Calculations are based on the official poverty measure using the 2020 Current Population Survey, Annual Social and Economic Supplement. https://doi.org/10.18128/D010.V10.0.
4.7.4.3 All Rights Reserved
Figure 4.15. Neuman, S. B. (2009). Changing the odds for children at risk: Seven essential principles of educational programs that break the cycle of poverty. Teachers College Press.
Used under fair use.
Image Description for Figure 4.9: Median Annual Earnings by Sex, 1960-2021.
A line chart shows that men earn more than women for all years . The lines go up and down with changes in the economy, but, while they come closer, they never cross or touch.In 1960, men’s median earnings were $43,095 while women’s were $26,148. In 2021, men’s median earnings were $61,180 while women’s were $51,226.
Note: Earnings are based on median annual earnings of full-time, year-round workers.
Data: U.S. Census Bureau, Current Population Survey, Annual Social and Economic Supplements, 1960-2022; U.S. Department of Labor, Women’s Bureau.
Designed by Elizabeth Pearce and Michaela Willi Hooper, Open Oregon Educational Resources, CC BY 4.0.
Image Description for Figure 4.10: People in the U.S. in Poverty by Family Structure
with Related Children under 18, 2021
A bar chart shows that unmarried, female-headed households have a much higher rate of poverty (37.2%) compared to unmarried, male-headed households (18.1%), or married couple households (the lowest, at 6.7%).
Data source: Table A-2. Families and People in Poverty by Type of Family: 2020 and 2021. US Census Bureau: https://www.census.gov/library/publications/2022/demo/p60-277.html
Design by Elizabeth Pearce and Michaela Willi Hooper, Open Oregon Educational Resources, CC BY 4.0.
Image Description for Figure 4.11: Real Median Income by Race and Hispanic Origin, 1967-2021
A line chart showing that between 1967 and 2021, Black households had a lower median income than any other racial or ethnic group measured. In 1967, Black households had a median income of just below $30,000, while the median income for all races was around $48,500. Beginning in 1972, White non-Hispanic households and Hispanic households of any race are also shown. In 1972, Hispanic households made around $42,500, while Black households made just under $33,000 and White, non-Hispanic households made just over $57,000. Beginning in 1987, Asian households were added. In that year, they made just over $70,400, while White, non-Hispanic households made just over $61,600, Hispanic households made just over $42,200, and Black households made just over $34,200. The lines go up and down, reflecting economic changes, but never cross. In 2021, Asian households made $101,418; White, non-Hispanic households made $77,999; Hispanic households made $57,981; and Black households made $48, 297.
Note: Adapted from https://www.census.gov/content/dam/Census/library/visualizations/2022/demo/p60-276/figure2.pdf. Households as of March of the following year. See link for full data notes and detail.
Source: U.S. Census Bureau, Current Population Survey, 1968-2022. Annual Social and Economic Supplements. This accessible, simplified version by Elizabeth Pearce, Jennifer Puentes, & Michaela Willi Hooper, Open Oregon Educational Resources, is licensed under CC BY 4.0.
Image Description for Figure 4.13: US Child Poverty Rate by Age Group, 2019
A bar chart shows that children ages 0-5 have the highest rate of poverty at 15.5%. Children aged 6-11 experience poverty at a rate of 14.9%, and children aged 12-18 experience poverty at the rate of 12.9%.
Data source: The Center for American Progress: https://www.americanprogress.org/article/basic-facts-children-poverty/
Calculations are based on the official poverty measure using the 2020 Current Population Survey, Annual Social and Economic Supplement. https://doi.org/10.18128/D010.V10.0
Design by Elizabeth Pearce and Michaela Willi Hooper, Open Oregon Educational Resources, CC BY 4.0.