
4.8 Social Welfare Programs
Following the Great Depression (1929–1939) the United States developed its first programs meant to combat and prevent poverty.. The following programs fall under the category of social welfare or public assistance. This group of programs is meant to alleviate the effects of poverty, and applicants must pass a means test in order to receive benefits. The benefit levels are determined by factors within each individual case and dependent upon the program.
4.8.1 Supplemental Security Income
Supplemental Security Income (SSI) is a federal program that serves low-income Americans who are aged (over 65), blind, and/or have a disability. It is funded by general tax revenues rather than Social Security payroll taxes. The benefits provided under SSI are intended to help recipients pay for food, clothing, and shelter—the basic necessities (Social Security Administration, 2015a). The income level at which one qualifies is the same nationwide. Although it is a federal program, some states supplement the payments made to recipients (Social Security Administration, 2009). The maximum federal benefit payment in 2022 for SSI was $1,261 for an eligible couple and $841 for an eligible individual (Social Security Administration, 2022).
4.8.2 Medicaid
Established as an addition to the Social Security Act in 1965 under President Lyndon B. Johnson, Medicaid came into existence simultaneously with Medicare. People often get the names of these programs confused with each other; an easy way to remember the difference is to say “Medicaid is public aid.” That is, Medicaid is health insurance available for the poor. Along with the Children’s Health Insurance Program (CHIP), Medicaid provides insurance to 72.2 million Americans who might otherwise not be able to afford doctor’s visits, emergency room visits, hospital stays, or medications (U.S. Department of Health and Human Services, n.d.). Medicaid is funded through a combination of state and federal monies and is administered entirely by the states (Cox, Tice, & Long, 2016; Matthews, 2015). States had the option to expand Medicaid with federal funds designated by the Affordable Care Act; 39 states have done so as of 2022 (Kaiser Family Foundation, 2022). Medicaid is discussed more in depth in Chapter 8.
4.8.3 Housing Choice Voucher Program
Commonly known as Section 8, the Housing Choice Voucher Program provides funding assistance to low-income families looking to obtain housing. There are two kinds of vouchers: a project-based voucher for public housing and a tenant-based voucher that can be used anywhere in the housing market. To receive either kind of voucher, an applicant must qualify through the completion of a means test. Different housing authorities have different income maximums for people to be eligible to receive assistance in these programs.


Figures 4.16, 4.17, and 4.18 Housing projects vary widely in size, location, and age, including these in New York City, New York and Dulth, Michigan. Housing voucher users may also live in standalone homes, or duplexes.
Recipients of both kinds of vouchers still have to pay a portion of their rent every month, referred to as the total tenant payment (TTP). While many people who use housing vouchers live in housing projects, others live in residential homes (Figure 4.X)
4.8.4 Supplemental Nutrition Assistance Program
Formerly known as food stamps, the Supplemental Nutrition Assistance Program (SNAP) provides financial assistance for low-income people to purchase food. Similarly to the way the poverty line is designated, SNAP benefits are based upon a frugal but healthy meal plan. However, that plan (which the USDA calls “nutritionally adequate”) requires nutrition knowledge, storage space, access to affordable markets, and equipment that may not be available or possessed by the poor (Levitan, Mangum, & Mangum, 1998).
Food Stamps began as a pilot program in several states thanks to an executive order by President John F. Kennedy, and they were made permanent by his successor, President Lyndon B. Johnson, in 1964 (Edelman, 2012; U. S. Department of Agriculture, 2014). By 1974, all counties in every state had to adopt a Food Stamps program, which made it “the country’s single most effective intervention against poverty” and “unquestionably a successful public policy story” (Abramsky, 2013, p. 74; Edelman, 2012, p. 12). In 2019, 38 million Americans used SNAP benefits (Hall, 2021).
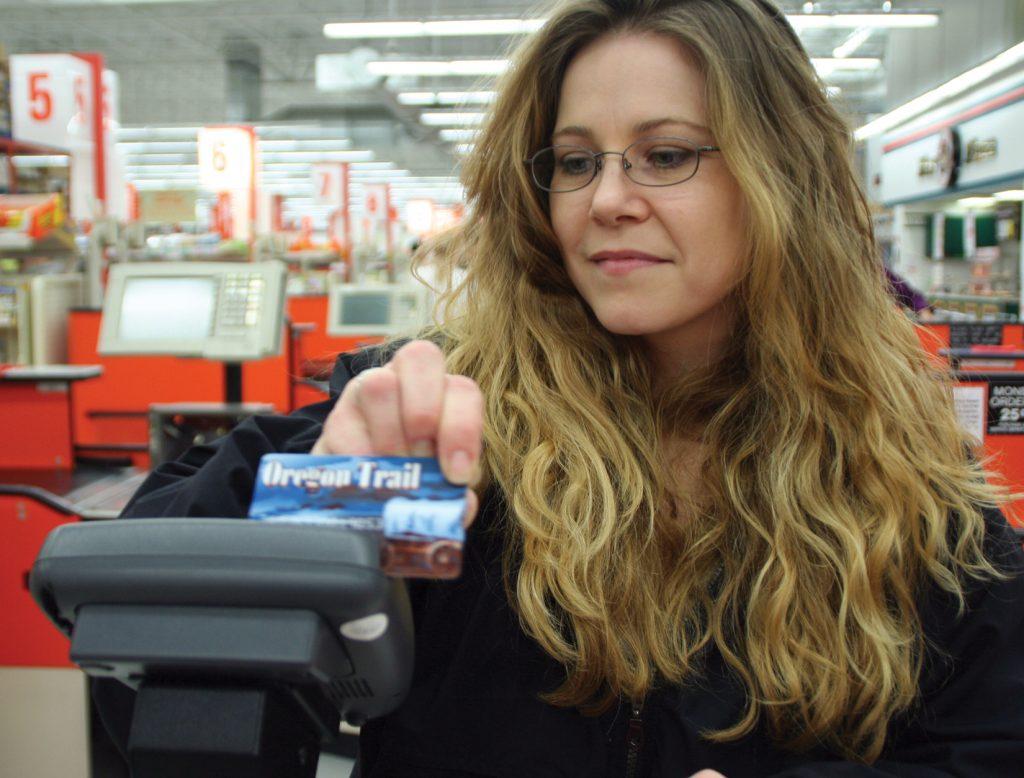
Figure 4.19. SNAP benefits are now disbursed in all states via electronic benefit transfer (EBT), so people accessing their public assistance funds are virtually indistinguishable at the register from any other customer paying with a credit or debit card.
SNAP benefits are enough to give five million Americans an income boost that brings them above the poverty line, according to the Department of Agriculture (2014). SNAP benefits vary widely by state, with 2014’s average monthly benefit per household of $463 in Hawaii at the high end and New Hampshire’s $193 bringing up the rear; the average payment per household across all states in 2014 was $239 (or $139.50 per person, since the average SNAP household has 2.0 people; U. S. Department of Agriculture, 2018).
There is an impression that people on SNAP simply make bad diet choices, but the evidence doesn’t support that assertion. SNAP participants are less likely to have excessive sodium in their diet, less likely to exceed recommended maximum intake of saturated fats, and just as likely to have adequate intake of vitamins and minerals (U.S. Department of Agriculture, 2015b). There are undoubtedly some people making unhealthy food choices, just as there are in other income groups, but SNAP participants face more stigma in general, including about food choices.
4.8.5 Healthy Meals for Healthy Americans
Formerly known as WIC (Special Supplemental Nutrition Program for Women, Infants and Children), Healthy Meals for Healthy Americans provides food, nutrition services, and access to health care for eligible women (typically pregnant women or new mothers), infants, and children up to age five who are considered to be at nutritional risk (U.S. Department of Agriculture, 2015a). Though the official title of the program is no longer WIC, that name continues to be used even on a number of government websites, and you may have seen food for sale at your local grocery store on shelves labeled “WIC item.” Families with an income up to 185% of the poverty line (for instance, $49,025 for a family of four in 2021) are eligible to receive benefits (U.S. Department of Agriculture, 2021).
4.8.6 Temporary Assistance to Needy Families
Under the Social Security Act, one of the public assistance programs founded was Aid to Dependent Children (ADC). The program was originally designed to provide financial support to poor single mothers, often widows. The prevailing social sentiment of the day was that a mother’s place was in the home, so the government provided ADC so these single mothers could care for their children at home with the help of public assistance (Levitan et al., 1998).
From the beginning, however, the program’s delivery has had an element of institutional racism to it. Several states implemented policies after the founding of ADC that gave state employees administering the program the ability to deny benefits to any applicants that were deemed not to have “suitable homes;” in practice, this meant nonwhites and families with children born out of wedlock were disproportionately denied benefits (Levitan et al., 1998; Morgen et al., 2010; Schorr, 2001). Ideologically, the thinkers behind the expansion of welfare recognized that racism had contributed to income inequality and poverty; sadly, the programs they succeeded in putting into place served as yet another part of the problem (Morgen et al., 2010)
The program was rechristened Aid to Families with Dependent Children (AFDC) in the 1960s, as it expanded to provide financial assistance to two-parent families rather than just households headed up by single parents.By the 1990s, a program that had originally been designed to care mostly for widowed mothers was more likely to be taking care of mothers who had never been married (Schorr, 2001).

Figure 4.20. Despite ample evidence to the contrary, many Americans think parents receiving public assistance intentionally have more children in order to increase their benefit; in reality, the average family on welfare is 30% smaller than in the 1960s.
The social climate began to favor more women, including single mothers, entering the workforce. However, the AFDC rules until the mid-1960s required AFDC mothers to report any income they made so it could be deducted from their benefits. Therefore, unless they found a job that could pay them more than their AFDC benefits plus the cost of child care, it simply made more sense to stay at home. They got no further ahead by working a low-paying job; they would be less financially stable and spending less time with their kids. (Schorr, 2001).
Families were also getting smaller as shown in figure 4.16, despite popular belief that unmarried mothers on welfare were simply having as many kids as possible to maximize their benefits. While a third of AFDC families had four or more kids in 1969, that was true for only about 10% in 1987; by 1995, the average size of a family on AFDC had fallen from 4.0 to 2.8 (Levitan et al., 1998; Schorr, 2001).
This all led up to the elimination of AFDC in the 1990s. Congress passed the Personal Responsibility and Work Opportunity Reconciliation Act (PRWORA) in 1996 and Clinton signed it into law, completely replacing AFDC with a program whose name rang a bit ominously: Temporary Assistance for Needy Families (TANF) (Morgan, Acker, & Weigt, 2010).
That first word is the key: temporary. The belief was that the vast differences between AFDC and TANF’s rules would push poor parents off the couch and into the workforce, if for no other reason than the benefits would run out. There were further provisions put into place as well;, AFDC didn’t require work, but TANF cut off benefits after two years in most cases if a recipient wasn’t working. The big question is, “Was it effective?”
While there were some signs of success, like decreasing caseloads for TANF caseworkers and fewer overall people receiving benefits since TANF was instituted, we have also had a significant recession, and a greater number of people likely in need of the program (Morgan, Acker, & Weigt, 2010). The fact that TANF rosters did not increase during that time is a cause for concern, because it means there was less of a safety net there for people who desperately needed it.
During the same time that TANF recipients decreased, there were significant increases in the numbers of recipients of SNAP and Unemployment Insurance, home foreclosures soared, and food banks also struggled to meet the increased need of their communities (Morgen et al., 2010). Making TANF’s rules stricter may have simply pushed clients to other programs. Their needs didn’t change. Some did find jobs, but they were generally low-paying jobs with little chance of facilitating a rise in economic status (Morgen et al., 2010). Reducing the number of clients receiving benefits is not the same thing as reducing poverty.
4.8.7 References
Abramsky, S. (2013). The American way of poverty: How the other half still lives. Nation Books.
Cox, L E., Tice, C. J., & Long, D. D. (2016). Introduction to social work: An advocacy-based profession. SAGE.
Edelman, P. (2012). So rich, so poor: Why it’s so hard to end poverty in America. The New Press.
Hall, L. (2021). A closer look at who benefits from SNAP: State-by-state fact sheets. Center on Budget and Policy Priorities.https://www.cbpp.org/research/food-assistance/a-closer-look-at-who-benefits-from-snap-state-by-state-fact-sheets.
Kaiser Family Foundation. (2022, July 21). Status of state medicaid expansion decisions: Interactive map. KFF. https://www.kff.org/medicaid/issue-brief/status-of-state-medicaid-expansion-decisions-interactive-map/
Levitan, S. A., Mangum, G. L., & Mangum, S. L. (1998). Programs in aid of the poor (7th ed.). The Johns Hopkins University Press.
Matthews, J. (2015). Social Security, Medicare & government pensions: Get the most out of your retirement & medical benefits. Nolo.
Morgen, S., Acker, J., & Weigt, J. (2010). Stretched thin: Poor families, welfare work, and welfare reform. Cornell University Press.
Schorr, A. L. (2001). Welfare reform: Failure & remedies. Praeger.
Social Security Administration (2015b). Spotlight on living arrangements—2015 edition. SSI spotlights. http://www.ssa.gov/ssi/spotlights/spot-living-arrangements.htm.
SSI federal payment amounts for 2022. (n.d.). Retrieved August 22, 2022, from https://www.ssa.gov/oact/cola/SSI.html#:~:text=SSI%20amounts%20for%202022,%24421%20for%20an%20essential%20person.
U. S Department of Agriculture (2014). 50 Years of SNAP [Infographic]. R http://www.fns.usda.gov/sites/default/files/snap/SNAP-infographic-banner.pdf.
U. S. Department of Agriculture (2015a). Women, Infants, and Children (WIC). http://www.fns.usda.gov/wic/women-infants-and-children-wic.
U. S. Department of Agriculture (2018). SNAP household state averages for SNAP benefits. https://www.fns.usda.gov/SNAP-household-state-averages#.
U. S. Department of Agriculture (2021). Income eligibility guidelines. https://www.fns.usda.gov/wic/2021-2022-income-eligibility-guidelines.
U. S. Department of Health and Human Services (2021). Annual update of the HHS poverty guidelines. https://www.federalregister.gov/articles/2015/01/22/2015-01120/annual-update-of-the-hhs-poverty-guidelines#t-1.
U. S. Department of Housing and Urban Development (n.d. a). HUD’s public housing program. Retrieved from http://portal.hud.gov/hudportal/HUD?src=/topics/rental_assistance/phprog.
U. S. Department of Housing and Urban Development (n.d. b). Housing Choice vouchers fact sheet. Retrieved from http://portal.hud.gov/hudportal/HUD?src=/program_offices/public_indian_housing/programs/hcv/about/fact_sheet.
4.8.8 Licenses and Attributions for Social Welfare Programs
4.8.8.1 Open Content Shared Previously
“Social Insurance Programs” is adapted from “Poverty and Financial Assistance” by Mick Cullen and Matthew Cullen, Social Work and Social Welfare and is licensed under CC BY-NC-SA 4.0. Adaptations by Elizabeth B. Pearce include light editing, vocabulary and context changes to adapt for the human services field, and updated images.
Figure 4.16. Housing Projects NYC by Axel Drainville is licensed under CC BY-NC 2.0.
Figure 4.17. “Duluth, MN Public Housing Project” by tvdxer is licensed under CC BY 2.0.
Figure 4.18 “White wooden house near green trees” by Kyle Smith is licensed under Unsplash.
Figure 4.19“Buying food with the EBT card” by Bread for the World is licensed under CC BY-NC-ND 2.0.
Figure 4.20. “Family of Three.” by iMorpheus is licensed under CC BY 2.0.