
8.3 The Aging Population
Since its creation in 1790, the U.S. Census Bureau has been tracking age in the population. Age is an important factor to analyze with accompanying demographic figures, such as income and health. The population pyramid in figure 7.2 shows projected age distribution patterns for the next several decades. As you go from the “pyramid” in green (representing 2010) to the fatter shaped “bullet” in dark purple (representing 2030) to the rectangular shape in lighter gray-purple (representing 2050), you can see that the population has many more people surviving into the older categories. This squaring up of the population means that the average age of the population is growing older, and the ratio of children and younger adults to older adults is decreasing.

Figure 8.2. As our population ages, the population “pyramid” begins to look more like a population “rectangle.”
Statisticians use data to calculate the median age of a population, that is, the number that marks the halfway point in a group’s age range. In the United States, the median age is about forty (U.S. Census Bureau, 2010). That means that about half of the people in the United States are under 40 and about half are over 40. This median age has been increasing, which indicates the population as a whole is growing older. This demographic change has enormous implications in terms of economics, health, and social needs. This also means that many more professionals are needed who are familiar with the needs of older adults. This means not only geriatricians (medical professionals who focus on the health of older adults) but gerontologists, who look at the other aspects that can be impacted by aging, including economics, social services, mental health, and spirituality, among others.
8.3.1 Demographic Changes Over Time
Demographically, the U.S. population over 65 years old increased from 3 million in 1900 to 33 million in 1994 (Hobbs, 1994) and to 36.8 million in 2010 (U.S. Census Bureau, 2011c). This is a greater than tenfold increase in the elderly population, compared to a mere tripling of both the total population and of the population under 65 years old (Hobbs 1994). This increase in the elderly population has been called the “graying of America,” or the “silver tsunami.” These terms describe the phenomenon of a larger and larger percentage of the population getting older and older.
There are several reasons why the United States is graying so rapidly. One of these is life expectancy: the average number of years a person born today may expect to live. When we review Census Bureau statistics grouping the elderly by age, it is clear that in the United States, at least, we are living longer. In 2010, there were about 80,000 centenarians (age 100+) in the United States alone. They make up one of the fastest growing segments of the population (Boston University School of Medicine, 2014). People over ninety years of age now account for 4.7% of the older population, defined as age 65 or above; this percentage is expected to reach 10% by the year 2050 (U.S. Census Bureau, 2011). As of 2013, the U.S. Census Bureau reports that 14.1% of the total U.S. population is 65 years old or older.
It is interesting (and somewhat alarming) to note that not all people in the United States age equally. Different ethnicities and socioeconomic groups can expect different outcomes as they age. The latest data from the National Institutes of Health estimates the average life expectancy of Asian Americans at 85.7 years, 82.2 years for the Latino population, 78.9 for Whites, 75.3 for the Black population, and a mere 73.1 years for American Indian/Alaskan Natives (NIH, 2022). The major cause of this difference is the likely accumulation of inequities throughout life that impact people’s health as they age. We discuss this in more detail later in the chapter.
Most glaring is the difference between men and women; as the chart in figure 8.2 shows, women have longer life expectancies than men. In 2010, there were ninety 65-year-old men per one hundred 65-year-old women. However, there were only eighty 75-year-old men per one hundred 75-year-old women, and only sixty 85-year-old men per one hundred 85-year-old women. Nevertheless, as the graph shows, the sex ratio actually increased over time, indicating that men are closing the gap between their life spans and those of women (U.S. Census Bureau, 2010).
8.3.2 Consequences of an Aging World
From 1950 to approximately 2010, the global population of individuals aged 65 and older increased by a range of 5–7% (Lee, 2009). This percentage is expected to increase and will have a huge impact on the dependency ratio: the number of nonproductive citizens (young, disabled, or elderly) to productive working citizens (Bartram & Roe, 2005).
One country that will soon face a serious aging crisis is China, which is on the cusp of an “aging boom”— a period when its elderly population will dramatically increase. The number of people above age 60 in China today is about 178 million, which amounts to 13.3% of its total population (Xuequan, 2011). By 2050, nearly a third of the Chinese population will be age 60 or older, which will put a significant burden on the labor force and impact China’s economic growth (Bannister et al., 2010).
8.3.2.1 Changing Family Structures
As the population ages, family structures are impacted dramatically. There are two major factors that are influencing the structure of the family. Traditionally, we refer to our ancestral chart as our “family tree.” The “roots” get wider with every generation back. However, along with living longer lives, people are having fewer children. This has changed family structure to what Vern Bengtson, a well known gerontologist, refers to as a beanpole family structure. Each generation is living longer, with fewer members in each, resulting in a longer, thinner chart rather than the traditional “tree” shape. This means each family has fewer members to rely on when help is needed.
8.3.2.2 Caregiving Issues
As healthcare improves and life expectancy increases across the world, elder care will be an emerging issue. With fewer working-age citizens available to provide home care and long-term assisted care to the elderly, the costs of elder care are likely to increase (Wienclaw, 2009).
Worldwide, the expectation governing the amount and type of elder care varies from culture to culture. For example, in Asia the responsibility for elder care lies firmly on the family (Yap et al., 2005). This is different from the approach in most Western countries, where the elderly are considered independent and are expected to tend to their own care. It is not uncommon for family members to intervene only if the elderly relative requires assistance, often due to poor health. Even then, caring for the elderly is considered voluntary. Western countries are more likely to rely on formal caregivers (professionals paid to provide such services) rather than informal caregivers (friends or family members who provide unpaid care).
In the United States, decisions to care for an elderly relative are often conditionally based on the promise of future returns, such as inheritance or, in some cases, the amount of support the elderly provided to the caregiver in the past (Hashimoto, 1996). These differences are based on cultural attitudes toward aging. In China, several studies have noted the attitude of filial piety (deference and respect to one’s parents and ancestors in all things) as defining all other virtues (Hsu, 1971; Hamilton, 1990).
Cultural attitudes in Japan prior to approximately 1986 supported the idea that the elderly deserve assistance (Ogawa & Retherford, 1993). However, seismic shifts in major social institutions (like family and economy) have created an increased demand for community and government care. For example, the increase in women working outside the home has made it more difficult to provide in-home care to aging parents, which leads to an increase in the need for government-supported institutions (Raikhola & Kuroki, 2009).
In the United States, by contrast, many people view caring for the elderly as a burden. Even when there is a family member able and willing to provide for an elderly family member, 60% of family caregivers are employed outside the home and are unable to provide the needed support. At the same time, however, many middle-class families are unable to bear the financial burden of hiring professional healthcare, resulting in gaps in care (Bookman & Kimbrel, 2011).
Within the United States not all demographic groups treat aging the same way. While most people in the United States are reluctant to place their elderly members into out-of-home assisted care, demographically speaking, the groups least likely to do so are Latinx, African Americans, and Asians (Bookman & Kimbrel, 2011). A 2018 data review (Themeer et al., 2018) showed that Black and Latino families are much less likely to use nursing homes, and that this division became bigger when socioeconomic differences were taken into account. However, it may not be just cultural or economic differences, This data may also reflect the lack of facilities with bilingual staff, or culturally appropriate foods.
Globally, the United States and other developed nations are fairly well equipped to handle the demands of an exponentially increasing elderly population. However, developing nations face similar increases without comparable resources. Poverty among elders is a concern, especially among elderly women. The feminization of the aging poor, evident in many developing nations, is directly due to the number of elderly women in those countries who are single, illiterate, and not a part of the labor force (Mujahid, 2006).
An aging population impacts society in many ways. The loss of workers will have economic impacts, and families will be stretched to provide care to their elderly members. The availability of at-home caregivers has decreased as most families require two incomes to stay above the poverty line. Also, availability of social services and assistance can vary by region. In Oregon, for example, the more populous Willamette Valley tends to have many resources available to residents. However, many areas in rural Eastern Oregon have little to no resources available. Rural elders, therefore, are much more vulnerable to changes in their ability to care for themselves. It is hoped that electronic resources can begin to fill some of these needs. Current research includes the role of telemedicine visits, electronic health monitoring, and even robotic pets and caregivers, as shown in Figures 8.3 and 8.4.


Figures 8.3 and 8.4. Engineers are creating robots that can interact with humans to help with caregiving and companionship
8.3.3 Grandparents as a Primary Resource
People in the United States, in general, are living longer and living healthier and more active lives. This, combined with the decrease in fertility, means that older adults have fewer children and grandchildren who are more widely spaced apart by age. This creates a capacity for both more active grandparenting than in previous generations, as well as the possibility of actual parenting of grandchildren and other caregiving relationships.It is believed that the combination of families having fewer children and living longer has led to more involvement by grandparents with their grandchildren, resulting in the increase in multigenerational families (where more than two generations live together) and grandfamilies (where grandparents or great-grandparents provide the primary care for their grandchildren). Simply put, people are living long enough to see their grandchildren be born, and to be an active part of their lives. Figure 8.5 Shows the percentage of grandparents who are responsible for the primary care of grandchildren
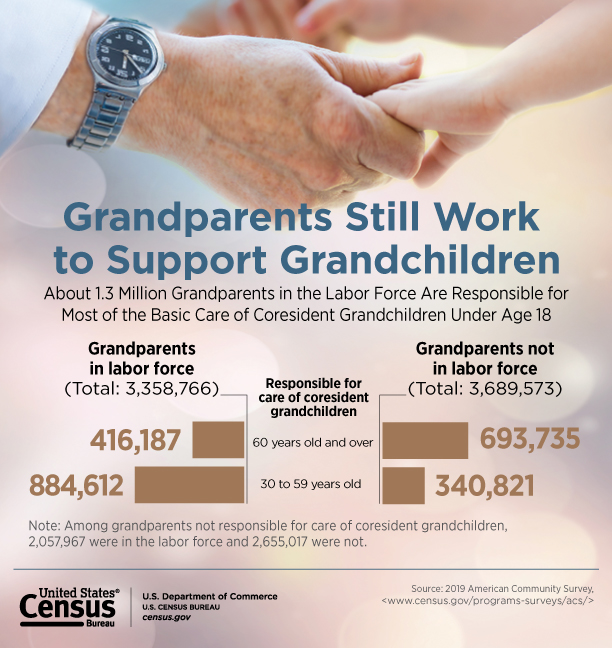
Figure 8.5 The 2020 Census Report shows that about 1.3 million grandparents are both working and caring for grandchildren
Simultaneously, rates of single parents and divorced parents have increased. These parents may call on their own parents for financial support, child care, shared housing, or other needs. In addition, social problems such as addiction and mass incarceration contribute to the need for more adults to be involved in parenting. Older adults, including grandparents, are more frequently involved in caregiving and supporting children and grandchildren than ever before. It is important to note that it is not only middle class or wealthy grandparents that are helping out; poor and working class grandparents are struggling to help out their children and grandchildren.
To learn more about grandfamilies struggling during the pandemic during 2021, watch this seven-minute PBS video.
Multigenerational households are on the rise after reaching a low of 12% in 1980. In 2016 roughly one in five adults (20%) lived in a multi-generational household, with an increase being attributed to the economic recession that started in 2009. The National Association of Realtors reports that multigenerational home purchases increased during the pandemic by four percentage points. These trends point out the connection between economic change, life expectancy, and living arrangements that affect family relationships.
8.3.4 References
Bannister, Judith, David E. Bloom, and Larry Rosenberg. 2010. Population Aging and Economic Growth in China. Cambridge, MA: The Program on the Global Demography of Aging.
Bartram, L., and B. Roe. 2005. “Dependency Ratios: Useful Policy-Making Tools?” Geriatrics & Gerontology International 5:224–228.
Bookman, Ann, and Delia Kimbrel. 2011. “Families and Elder Care in the Twenty-First Century.” The Future of Children 21:117–140.
Hamilton, Gary. 1990. “Patriarchy, Patrimonialism, and Filial Piety: A Comparison of China and Western Europe.” British Journal of Sociology 41:77–104.
Hashimoto, Akiko. 1996. The Gift of Generations: Japanese and American Perspectives on Aging and the Social Contract. New York: Cambridge University Press.
Hobbs, Frank. 1994. “The Elderly Population.” Population Profile of the United States. Retrieved January 28, 2012 (http://www.census.gov/population/www/pop-profile/elderpop.html).
Hsu, Francis. 1971. “Filial Piety in Japan and China: Borrowing, Variation and Significance.” Journal of Comparative Family Studies 2:67–74.
Lee, Mary. 2009. “Trends in Global Population Growth.” Research Starters Sociology: Academic Topic Overview. Retrieved January 28, 2012 from (http://www.ebscohost.com/academic/academic-search-premier).
Mujahid, G. 2006. “Population Ageing in East and South-East Asia: Current Situation and Emerging Challenges.” Papers in Population Ageing No.1. New York: United Nations Population Fund. Retrieved January 28, 2012 (http://www.eldis.org/assets/Docs/23355.html).
Ogawa, Naohiro, and Robert Retherford. 1993. “Care of the Elderly in Japan: Changing Norms and Expectations.” Journal of Marriage and the Family 55:585–597.
Raikhola, Pushkar Singh, and Yasuhiro Kuroki. 2009. “Aging and Elderly Care Practice in Japan: Main Issues, Policy and Program Perspective; What Lessons Can Be Learned from Japanese Experiences?” Dhaulagiri: Journal of Sociology & Anthropology 3:41–82.
Thomeer, M., Mudrazija, S. and Angel, J. (2018). How and why does nursing home use differ by race and ethnicity? The Journals of Gerontology: Series B, 73 (4), e11–e12, https://doi.org/10.1093/geronb/gbv056
U.S. Census Bureau. 2011. “Population.” The 2012 Statistical Abstract. Retrieved January 28, 2012 (http://www.census.gov/compendia/statab/cats/population.html).
Wiencaw, Ruth. 2009. “Caring for the Elderly in America.” Research Starters. Retrieved January 28, 2012 (http://www.ebscohost.com/academic/academic-search-premier).
Xuequan, Mu. 2011. “Premier Wen Join Nursing Home Seniors to Celebrate Mid-Autumn Festival.” Retrieved February 12, 2012 (http://news.xinhuanet.com/english2010/china/2011-09/13/c_131134367.htm).
Yap, Mui Teng, Leng Leng Thang, and John W. Traphagan. 2005. “Introduction: Aging in Asia—Perennial Concerns on Support and Caring for the Old.” Journal of Cross-Cultural Gerontology 20:257–267.
8.3.5 Licenses and Attributions for The Aging Population
“The Aging Population” from “Who Are the Elderly? Aging in Society” in Introduction to Sociology 2e by Tonja R. Conerly, Kathleen Holmes, Asha Lal Tamang, OpenStax. License: CC BY-SA 4.0. Edited for style and addition of current data.
“Grandparents as Primary Resource” is by Elizabeth B. Pearce and licensed CC BY-SA 4.0. Edited to add current data
Figure 8.2 “Age and Sex Structure of the Population for the United States: 2010, 2030, and 2050″ by Grayson K. Vincent and Victoria A. Velkof, U.S. Census Bureau is in the public domain.
Figure 8.3. Photo of Halodi Robotics’ Perception Engineer with a Humanoid Collaborative Robot by Nicholas-halodi, CC BY-SA 4.0, via Wikimedia Commons.
Figure 8.4. Photo of robotic puppy by Toyloverz, CC BY-SA 3.0, via Wikimedia Commons.
Figure 8.5 from 2020 Census Report https://www.census.gov/library/visualizations/2022/comm/grandparents-work-support-grandchildren.html retrieved 8/24/2022