
1.2 The Family: A Socially Constructed Idea

Figure 1.1. Social constructions are ideas that reflect the world in which we live.
To begin our study of contemporary families in the United States, we will first define an important concept that is used for a large portion of this book: social constructions. A social construction is a mutual understanding and accepted reality created by members of a society: something that is not determined by biology or the natural world. In the same way that the reflection of a train in Figure 1.1 represents a real object, our socially constructed ideas are reflections of the real world.
Is there anything that humans have created that holds no real value in the natural world, yet we have assigned a great deal of value to it? If you are thinking of cash, you’re right on the money. Humans have determined that certain pieces of paper and metal objects are worth an agreed-upon value. For example, in the United States, a one dollar bill is worth 100 times the value of a penny. One of the ways that we can tell money is a social construction is that it varies from culture to culture and over time. When you visit another country, the United States dollar bill has to be “exchanged” for money that has a different appearance and value.
Compare money with another thing of value to human beings: air. Air is needed by all human beings to survive. The need for air and its value do not change over time or from culture to culture.
Social constructions also relate to behavior and activities. For example, what food would you expect to see on the menu when you go out for breakfast in the United States? What if the eating place were described as a “Mexican” restaurant? And what if you traveled to another country, say, Korea? What is eaten for breakfast varies from culture to culture and even person to person. And yet, in general, we have a socially constructed idea of what is typically breakfast food in the United States: eggs, bacon, cereal, toast, and fruit, but not vegetables, noodles, pinto beans, or hot dogs.
One of the ways that you can recognize that something is a socially constructed idea is that it differs from place to place and changes over time. In addition, whatever is part of the socially constructed idea (in this case what typical breakfast foods are) becomes “the norm” or what is expected. While we might welcome trying some different foods for breakfast, they are not what is seen as the typical, or expected, American breakfast foods (Figure 1.2).


Figure 1.2. Breakfast burrito; eggs, bacon, strawberries, and sweet potato roll, and steamed buns represent a variety of breakfasts that are common around the world.
What does this have to do with families? While studying families, we must continually remind ourselves that the idea of the family, and in particular the internalized belief that there is a “normal family,” is a social construction. What is a normal family? I suspect that we can each paint a picture in our heads, based on the years each of us has been exposed to portrayals of families in institutions such as the media, schools, government, and health care.
Generally, the traditional American family has been identified as the nuclear family, most often represented as a male and female heterosexual married couple who is middle class, White, and with several children. When society or the individuals within a society designate one kind of family to be traditional, this may imply a value, or a preference, for this kind of family structure with these particular social characteristics. This is sometimes called the Leave it to Beaver family after the popular sitcom television show that ran from 1957 until 1963 (Figure 1.3, on left).
A current popular sitcom, Modern Family, which concluded its 11th and final season in 2020, also features this traditional family, but includes two other families which feature people of other ethnic groups, and a same-sex couple (Figure 1.3, on right). Together they form an extended family who all live in the same town. It is important to note, however, that the primacy of the upper middle-class, White family image continues to be emphasized.
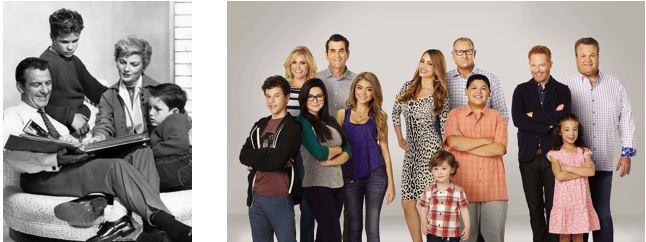
Figure 1.3. TV families in the 1950s and today.
1.2.1 Societal Contributions to the Social Construction of Difference
As we study families we must keep in mind that this idea of the typical family is not representative of all families, yet it is continually reinforced by the social processes and institutions in our society. Media in particular continually reminds us of what families are “supposed to” look like. Whether you consume big-budget films, social media platforms, video games, and/or books and magazines, take a look. What kind of people and families do you see represented? While representation of women, people of color, and people of differing sexualities and gender expressions has increased in media, they still predominantly play less consequential characters within the plot lines.
Although the majority of families in the United States no longer fit the traditional model (Pew Research Center, 2015), social institutions perpetuate the idea of a certain family structure. Government, schools, medical institutions, businesses, and places of worship all reinforce a typical view of family through the forms, activities, requirements, and processes that are shared with the public. How many times have you tried to fill out a form with checkboxes only to find that you did not “fit” into one of the boxes? Typical examples include giving parental choices of “mother” and “father,” couple status choices such as “married” or “single,” and gender choices such as “male” or “female,” all of which reinforce a binary view of individuals and families.
The preference for an idealized traditional family type contributes to the experience of having less social support for families who don’t fit this ideal: for example, single-parent families, LGBTQ+ families, rural families, or families with a member who is disabled, unemployed, or who has a criminal record. Accepted structures and practices such as “Daddy-Daughter Dances,” churches that exclude or condemn LGBTQ+ ministers or members, the lack of safe and healthy housing for low income families, and educational materials that cannot be read with low vision are all examples of ways that some individuals and families are less recognized and less privileged. You can probably think of other examples from your own family’s perspective. Socially constructed ideals contribute to other family forms being differentiated as less recognized and valued.
The social construction of difference describes value being assigned to a perceived difference (in this case, the form and function of families; Johnson, 2006). Allan Johnson is an author who wrote about differences in privilege related to social identities such as race, ethnicity, gender, and ability. We will extend this concept he described to include the social construction of difference among families. Via the socially constructed idea of family, American systems and structures regularly create and reinforce inequities among American families.
1.2.2 Equity, Equality, and Fairness
You will notice that this text often refers to equity rather than equality or fairness. We define equity as everyone having what they need, acknowledging that systemic inequities have affected people differently, and working to ensure that all members of society have access to the same opportunities and outcomes. The drawing in Figure 1.4 illustrates the difference between equity and equality. You may have seen different variations of this concept as memes on social media. 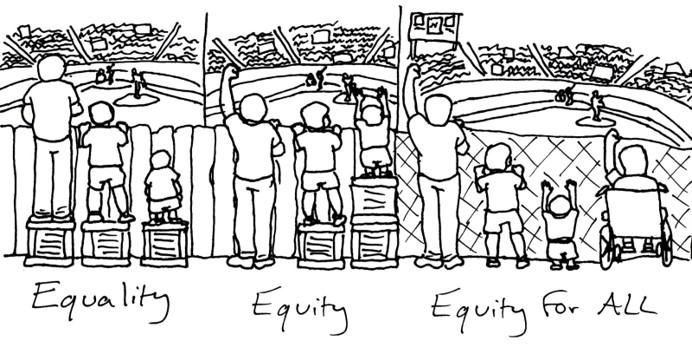
Figure 1.4. Equity means giving some people more (an additional box) so that they can have the same experience. To create equity for all, barriers are removed.
All families need equitable resources, but sometimes experiences and structures get in the way. In the first panel of the drawing, all of the participants have equal-sized boxes, but they do not all get to have an equal experience. In the second drawing, the participants can have the viewing experience because the boxes have been equitably distributed. And in the third panel, the structure that limited equitable access, the fence, has been removed so that all participants can view the game without additional resources.
In this text, we study American families with an emphasis on the current inequities in the United States. To help us understand the socially constructed nature of our view of the family and the systems that affect families, we take a comparative approach (American Sociological Association, 2020). This means that, while our focus is current American families, we will also look at how families have evolved in America, what the practices are of immigrant cultures in America, and how other countries develop systems that affect families. We also utilize empirical research, data that are collected in a variety of ways, analyzed, and presented to further our understanding.
1.2.3 Twenty-First Century American Families
While we are studying families, it is important to note the concept of kinship. While definitions vary, it is widely agreed that the term kinship is broader than the term family. Kinship refers to the social structure that ties people together (whether by blood, marriage, legal processes, or other agreements) and includes family relationships. Kinship acknowledges that individuals have a role in defining who is a member of their own family and how familial relationships extend across society.
What are families in the United States like today? Because we are constrained by both our personal experiences, as well as the societal representations of “typical families,” it is important to talk about what kinds of kinship structures and changes are actually occurring. At times, the study of families has been referred to as the study of “the family.” This text avoids that terminology because we are studying many types of families.
In order to describe current American families and kinship structures, it is probably easiest to compare them with families of the past and families in other countries. Here is a snapshot of some kinship patterns:
1.2.3.1 Increasingly Varied Family Arrangements
In Figure 1.5, based on data from the Pew Research Center, increases are noted in children living with a single parent and cohabiting parents.
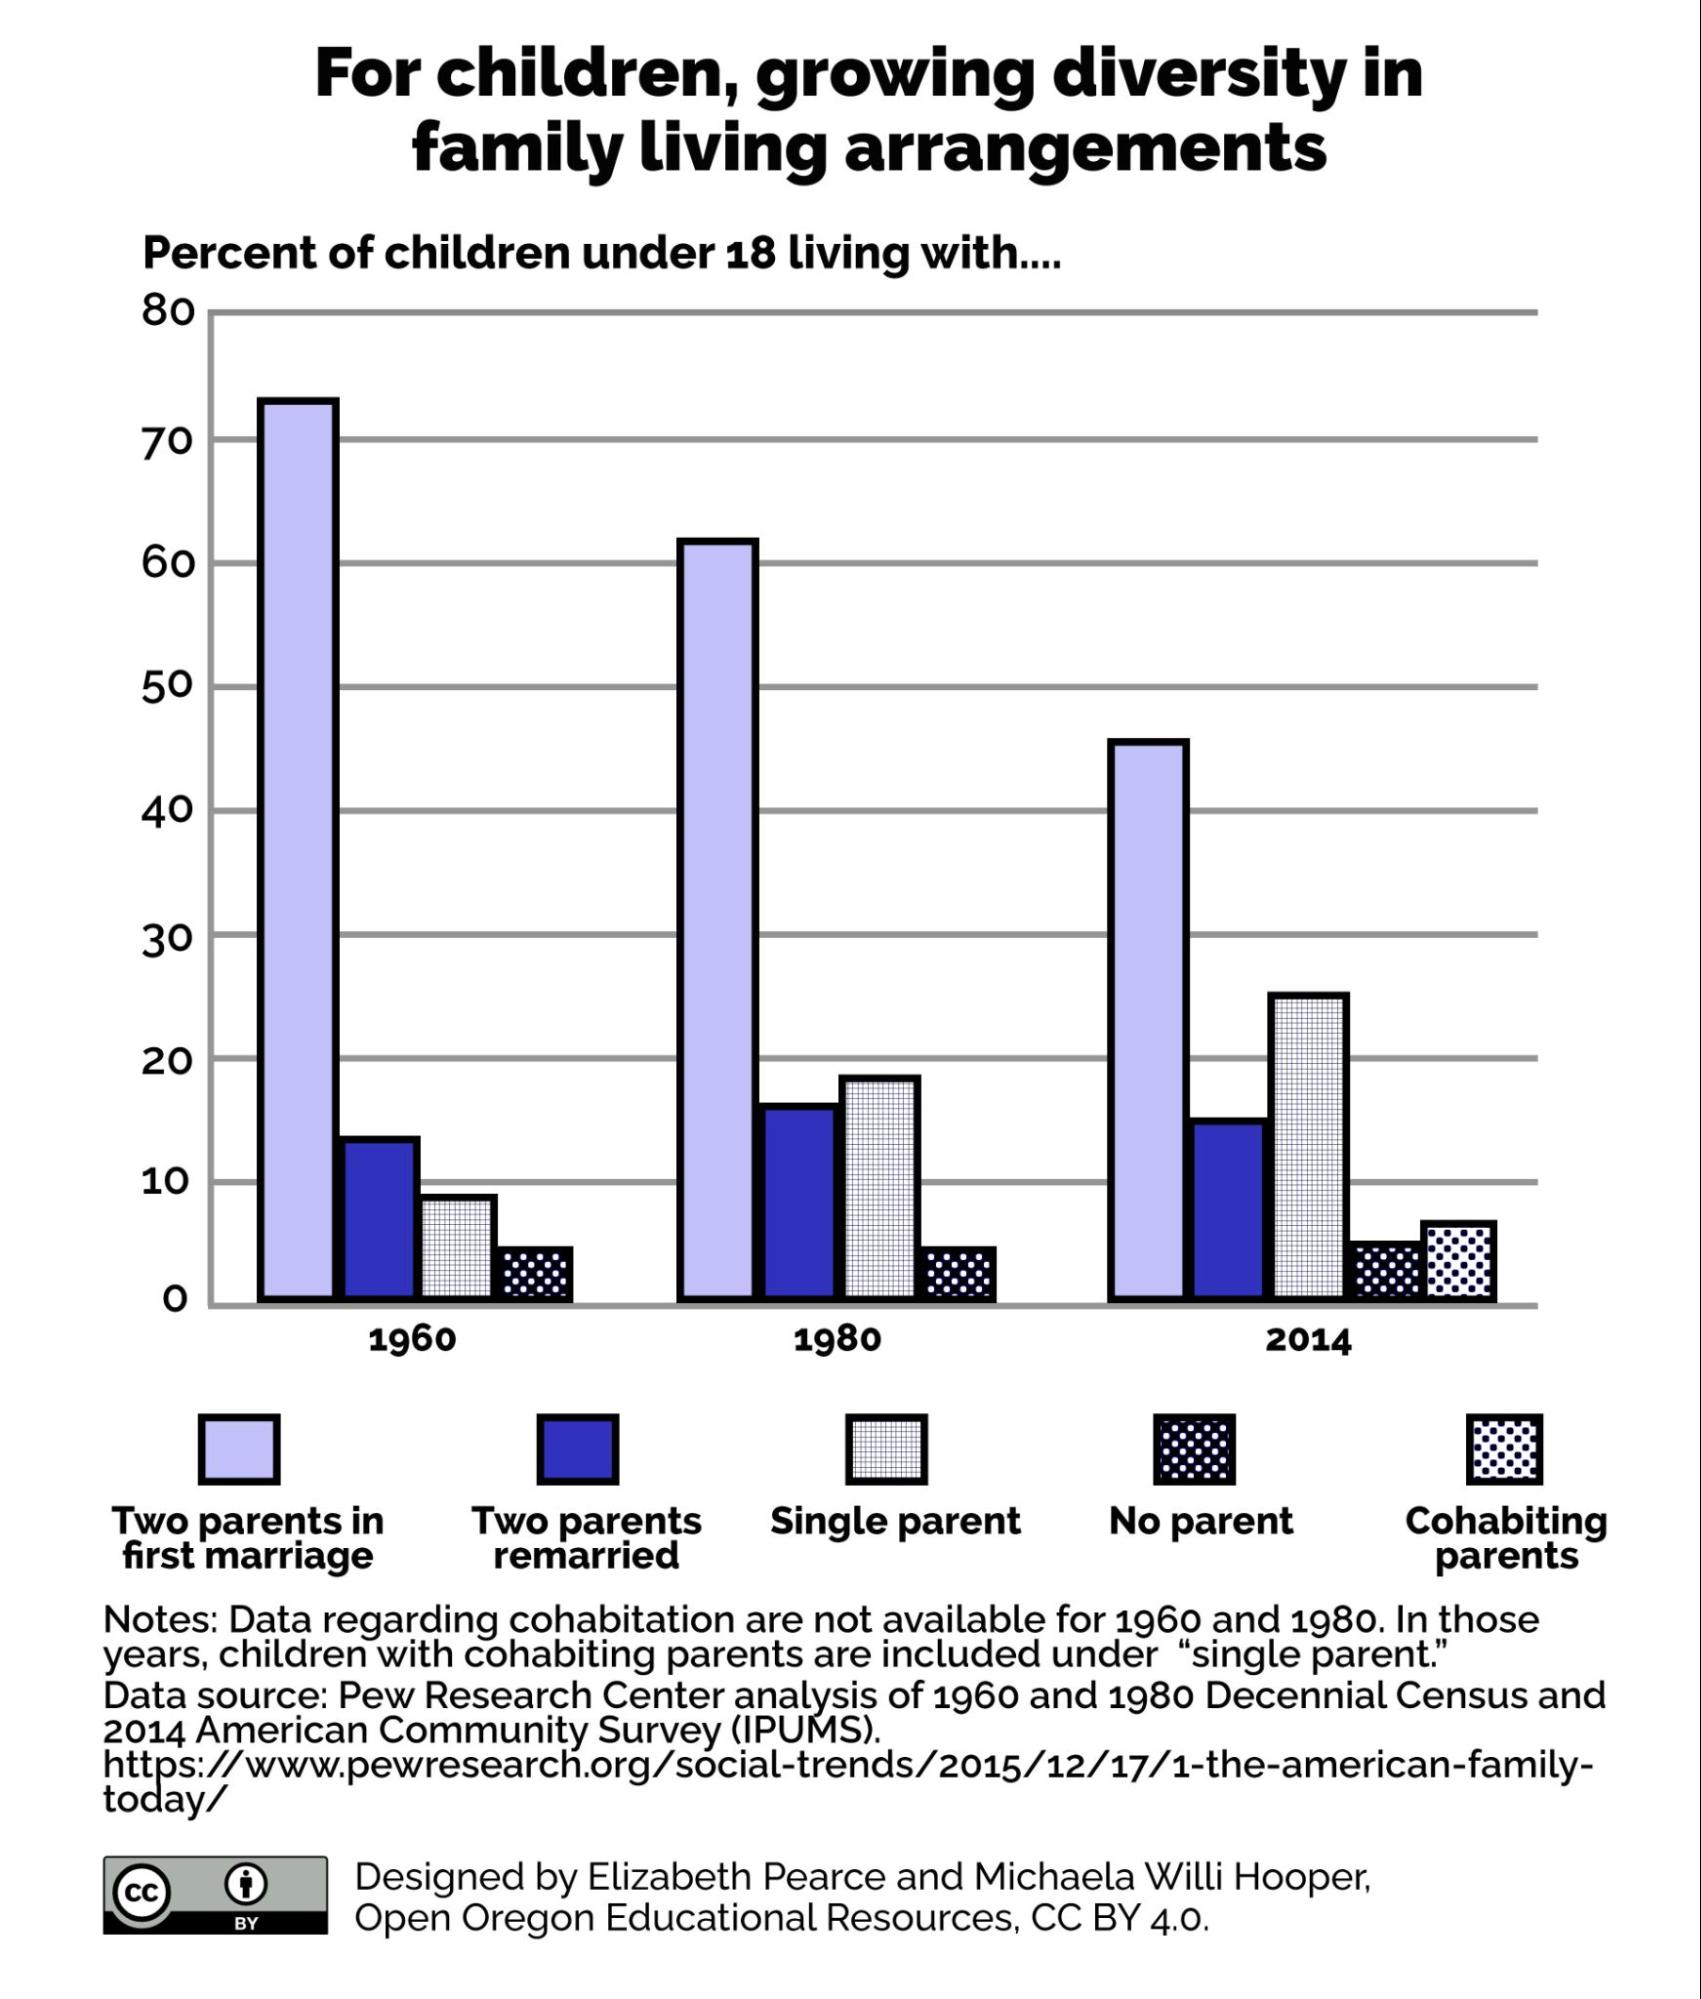
Figure 1.5. Growing diversity in family living arrangements. Data from Pew Research Center.
Data for cohabitation was not available in 1960 and 1980; those children were included in the group “single parents.” Figure 1.5 Image Description
1.2.3.2 Marriages Later in Life
Figure 1.6 shows the increase, for both men (blue, top line) and women (red, bottom line) in the median age of first marriage.

Figure 1.6. A Census graph showing the age of first marriages going up since the 1950s. Figure 1.6 Image Description
1.2.3.3 Declining Marriage and divorce Rates
In the chart in Figure 1.7, you can see that the marriage rate (blue, bottom) is declining a bit faster than the divorce rate (red, top), which is one of the factors that makes it appear as if divorce is increasing. It’s actually declining, just at a slower rate than marriage is declining:
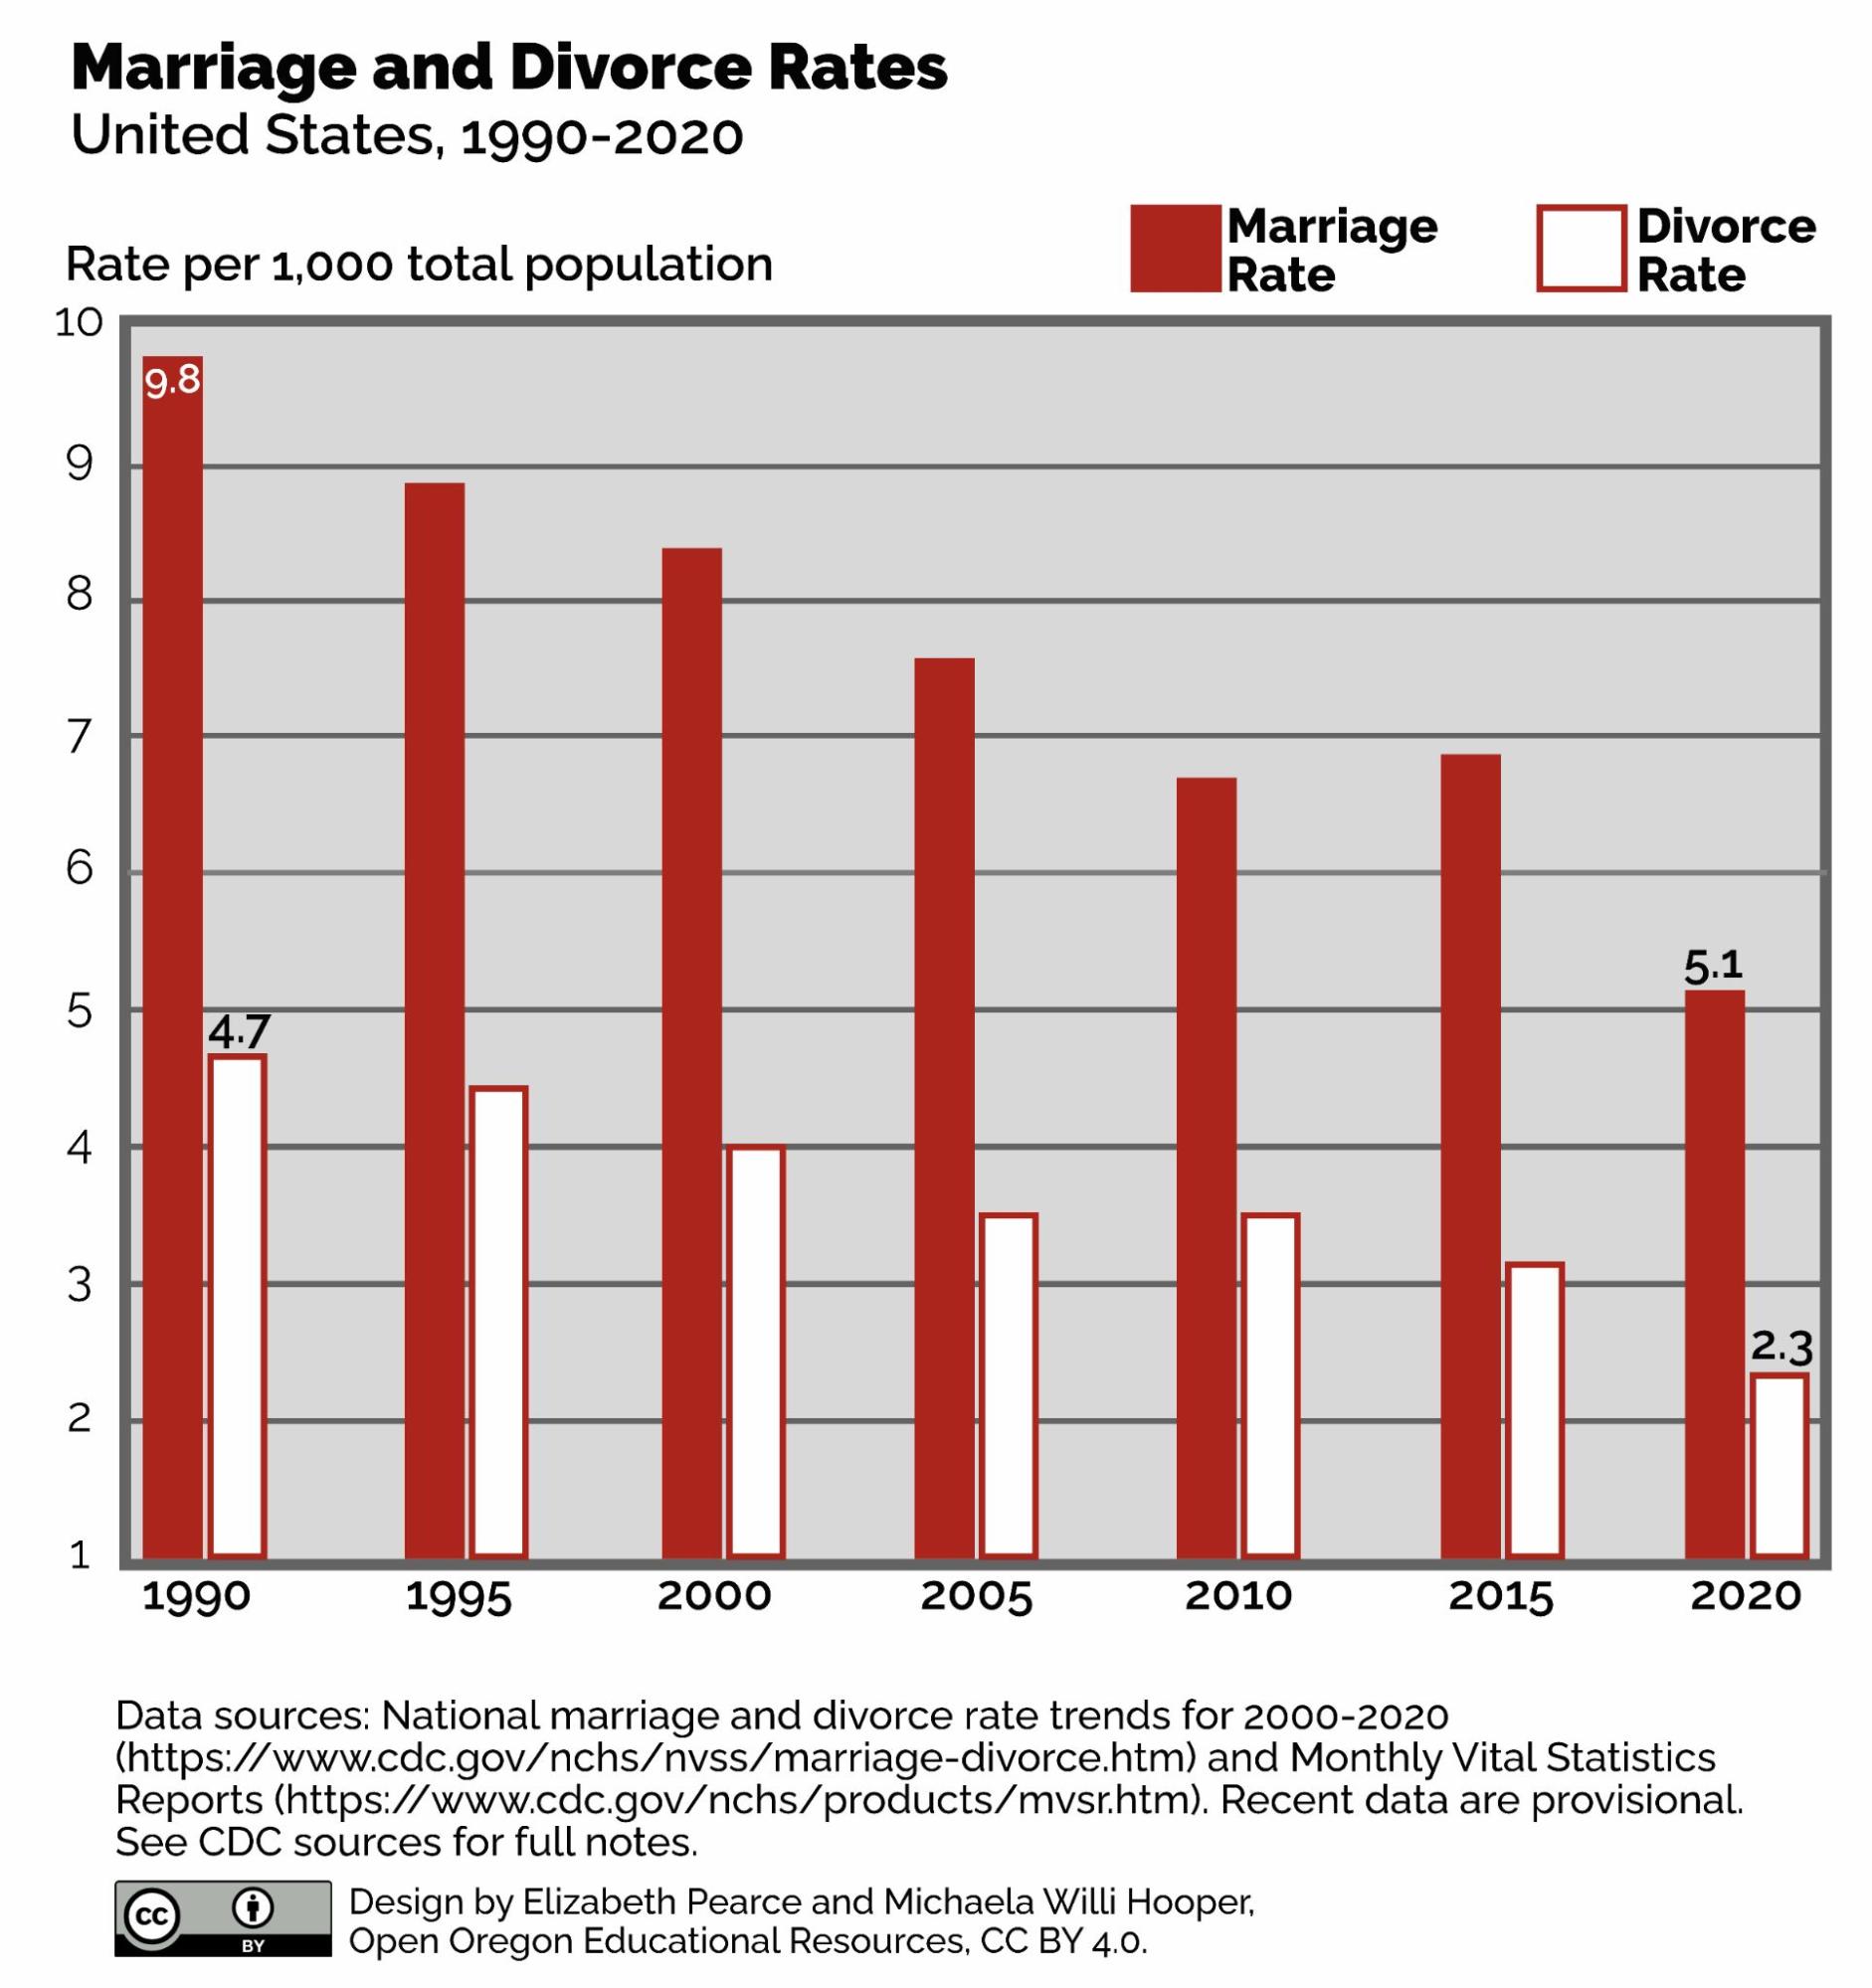
Figure 1.7. Marriage and divorce rates have gone down since the 1990s. This data comes from Statistical Abstract, 2009 based on the U.S. Census. Figure 1.7 Image Description
1.2.3.4 Declining Fertility Rates and Birth Rates
Women are having fewer children, following the “Baby Boom” years between approximately 1946 and 1964 as shown in Figure 1.8.
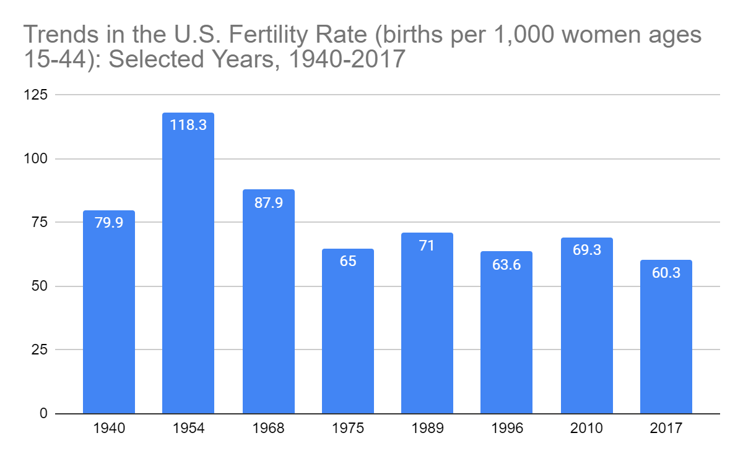
Figure 1.8. Fertility rates in the United States have declined since peaking in 1954; related social, economic and biological factors will be explored in Chapter 4.
1.2.3.5 Multigenerational households.
Multigenerational living includes families with two or more adult generations and families that have grandchildren under age 25 and grandparents living together. This style of living hit a low of 12% of all families in the United States in 1980. Since then, multigenerational living has increased in most racial and ethnic groups, age groups, and genders. Figure 1.9 illustrates the trend of multi generational living in the United States (Pew Research, 2018).
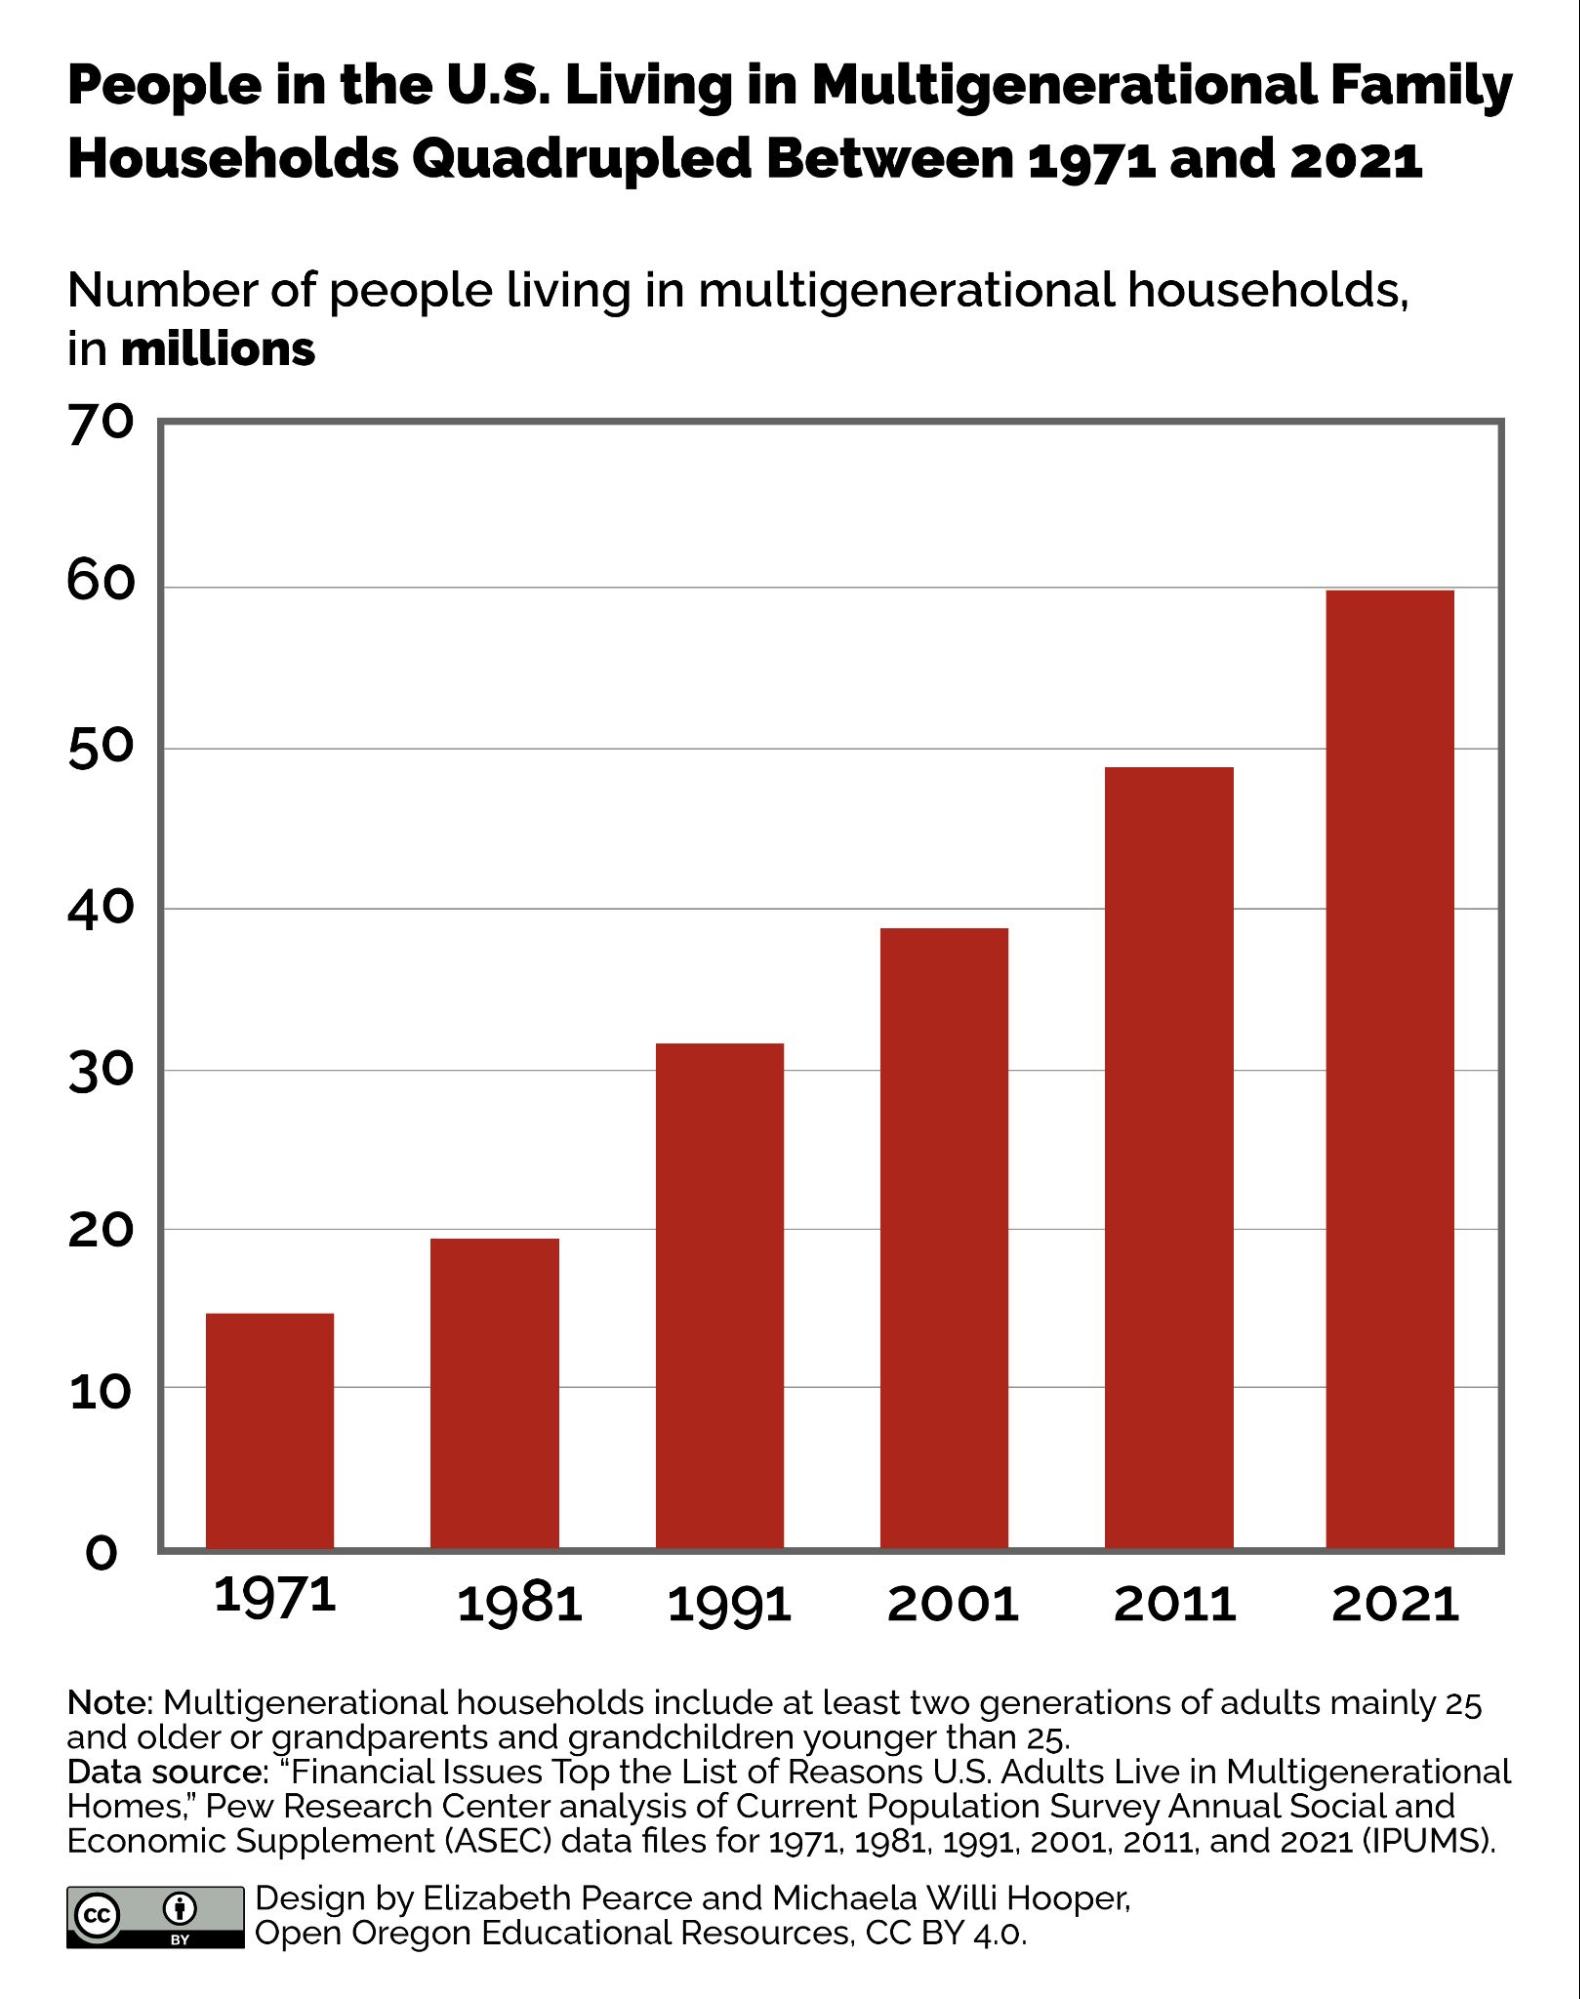
Figure 1.9. The number of Americans who live in multigenerational households has increased since the low in the 1970s. This graph is based on an analysis by the Pew Research Center based on data from the U.S. Census and 2000-2016 American Community Survey. Figure 1.9 Image Description
1.2.3.6 Longer Working Lives
Beneficial trends such as longer life expectancy and being healthier longer affect people’s decisions to work longer. Less beneficial trends such as concern about having adequate health care coverage, fewer jobs that have pensions associated with them, and the increasing number of workers who have multiple part-time jobs also affect this trend. These factors, along with the increases in cost of living, have contributed to the middle class shrinking.
The graph in Figure 1.10 shows differentiation by gender and by education level, but there is also differentiation related to wealth, income, and kind of employment. Look at the difference between 1992 (light blue, left hand column) and 2004 (red, right hand column). Notice that for both genders, and with all education levels, people are expecting to work longer.
Figure 1.10. People are expecting to work longer.
But expectations do not always match experience, and there is sufficient evidence that older workers are consistently forced out of stable, well-paying jobs at a significant percentage, as you can see in Figure 1.11.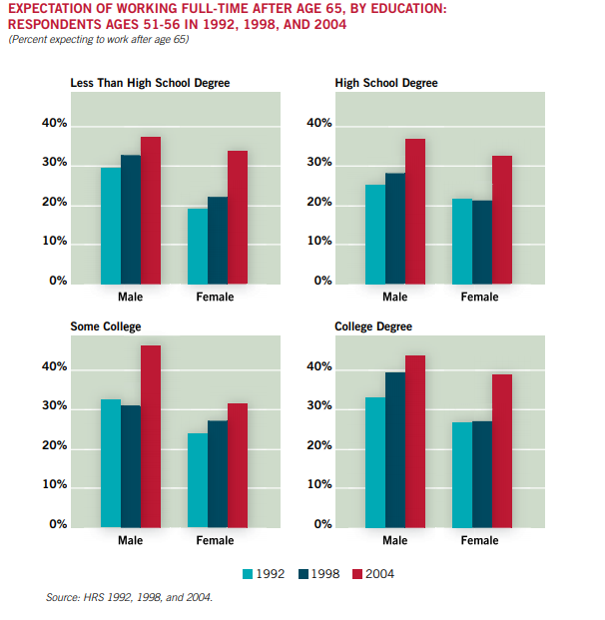
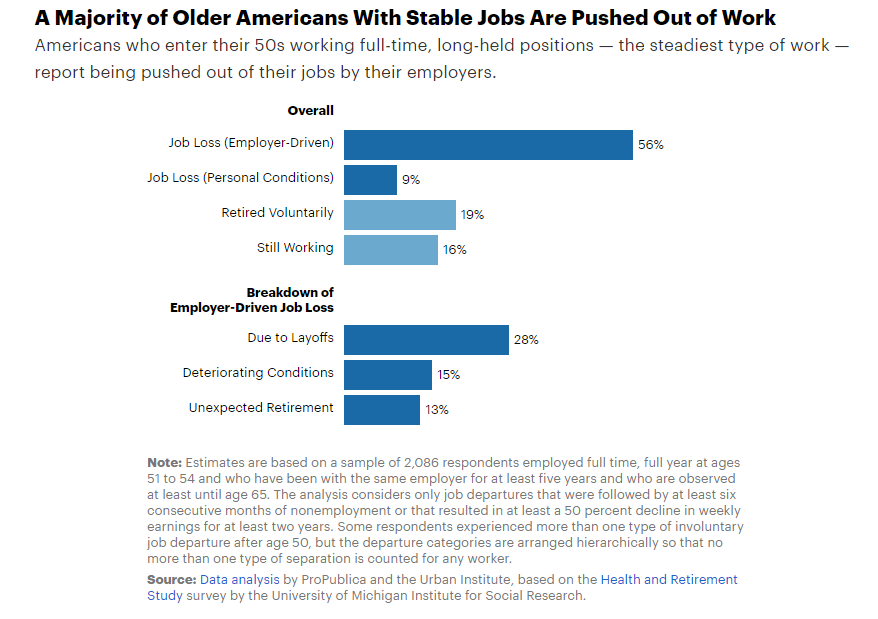
Figure 1.11. Most Americans don’t retire because they want to.
1.2.4 Families and Society
Scholars, as well as the general public, have multiple viewpoints about the meaning of families within society. While families have evolved, so have the ways each of us think about our own family, as well as how we think about how families should and could interact within themselves and with social structures.
In this text the authors describe multiple accepted theories and perspectives, with an eye to including diversity of thinking. These theories don’t necessarily conflict with one another. Rather, they offer different views of how families interact within themselves and within society.
1.2.4.1 Family as Haven, Fulfillment, and Encumbrance
Sociologist Maxine Baca Zinn examines the ways that ideas and images of families influence family expectations and interactions. Specifically, she describes family as haven, family as fulfillment, and family as encumbrance (Zinn et. al., 2011).
The family as haven describes the contrast that has historically been made between home spaces and work spaces in the United States. The idea that we live in a “heartless world” where individuals cannot expect to be treated with compassion isolates those caring characteristics to the home and family. The family became the place of warmth, tenderness, and morality in contrast to a world of commerce and competition, especially as society became more industrialized. It became a place where protection was offered.
The idea of family as fulfillment emerged in the later part of the 20th century as expectations increased for individual family roles as well as the home and family environment. For example, more intensive parenting to raise well-developed children, became more idealized and seen as fulfilling for parents. In addition, the family as a whole was not seen just as an escape from the harsh world, but also a place for enjoyment, creating meaning, and rejuvenation.
The family as encumbrance recognizes the ways in which the family ideals encompass responsibilities, effort, and stagnation. Monogamous marriage and parenting can be monotonous. This can get in the way of self-actualization and freedom to have the fullest experience of self. While both the family as fulfillment and as encumbrance incorporate the societal ideals of reaching one’s full potential, they represent two differing ways that the family can be viewed and experienced.
1.2.4.2 The Private and Public Functions of Families
Sociologist Andrew Cherlin uses the lens of private and public functions to view families. Notably, American society today is more concerned with the private function of families, which focuses on the intimate relationships of family members. Being a part of a loving relationship that will last forever, or an indefinite amount of time, is seen as a core part of being a family member (Cherlin, 2016).
In the past, and today in other cultures and countries, families focused more on the public function, such as the production of children, who could contribute both to family well-being, but also to society. This perspective is similar to what would be called public goods (or the products produced and used by the public) in an economic model. The most common public good in American families are children, but caring for elderly or differently-abled adults with disabilities could also be considered as producing a public good. Volunteering and contributing to places of worship, charitable organizations, and other not-for-profit agencies is another way to perform the public function.
As public institutions, families support, contribute to, and benefit from the overall social structure, which describes the organization of institutions within a society and affects the ways individuals and families interact. Although our society currently focuses on the private function, families implicitly perform both; these functions are complementary to one another. In this text we will raise awareness of the public function.
The focus on the private function of families and on self-actualization as an important part of life may relate to the United States’ identity as an individualistic society (Morin, 2019). In America, there is a focus on what individuals can achieve, with value placed on accomplishments that are gained without the support of society. Many other countries have collectivist societies (Psychology Wiki, 2019) which emphasize social support for all, so that all members of the group are able to meet their goals and needs.
1.2.4.3 Want to Learn More?
- Delve into additional data and read more about how this affects families, read “If You’re Over 50, Chances Are the Decision to Leave a Job Won’t be Yours,” a data analysis by ProPublica and the Urban Institute.
1.2.5 Licenses and Attributions for The Family: A Socially Constructed Idea
1.2.5.1 Open Content, Original
“The Family: A Socially Constructed Idea” by Elizabeth B. Pearce is licensed under CC BY 4.0.
Figure 1.4. “Equality, Equity, Equity for All” by Katie Niemeyer. License: CC BY 4.0. Based on ideas originally illustrated by Angus Maguire and Craig Froehle.
Figure 1.5. “For children, growing diversity in family living arrangements” by Elizabeth Pearce and Michaela Willi Hooper. License: CC BY 4.0. Based on data from Pew Research Center.
Figure 1.7. “Marriage and Divorce Rates United States, 1990-2020” by Elizabeth Pearce and Michaela Willi Hooper. License: CC BY 4.0. Data from National marriage and divorce rate trends for 2000-2020 and the Monthly Vital Statistics Reports, CDC. Recent data are provisional. See sources for full notes.
Figure 1.8. “Trends in the U.S. Fertility Rate.” License: CC BY 4.0. Based on data compiled by childtrends.org.
Figure 1.9. “One-in-five Americans live in a multigenerational household” by Elizabeth Pearce and Michaela Willi Hooper. License: CC BY 4.0. Based on data from “Financial Issues Top the List of Reasons U.S. Adults Live in Multigenerational Homes,” Pew Research Center analysis of Current Population Survey Annual Social and Economic Supplement (ASEC) data files for 1971, 1981, 1991, 2001, 2011, and 2021 (IPUMS).
1.2.5.2 Open Content, Shared Previously
Figure 1.1. Photo by Krzysztof Kotkowicz. License: Unsplash License.
Figure 1.2. “Breakfast Burrito” by JBrazito. License: CC BY-NC 2.0, “Sunday brunch: sweet potato rosti, bacon, fried egg & strawberries” by SaucyGlo is marked with CC BY 2.0, “Chinese breakfast” by Daniel Y. Go is marked with CC BY-NC 2.0.
Figure 1.6. “Median age at first marriage: 1890-present” by the US Census. Public domain.
Figure 1.10. “Expectation of working full time after age 65” is from the Health and Retirement Study by the National Institute on Aging. Public domain.
Figure 1.11. “A majority of older Americans with stable jobs are pushed out of work” by Peter Gosselin/ProPublica. License: CC-BY-NC-ND 2.0.
1.2.5.3 All Rights Reserved Content
Figure 1.3. Modern Family photo (c) American Broadcasting Company. Image used under fair use. Adaptations: juxtaposed with Leave it to Beaver photo.
1.2.6 References
Pew Research Center. (2015, December 17). The American family today. https://www.pewsocialtrends.org/2015/12/17/1-the-american-family-today/
Johnson, A.G. (2006). Privilege, power, and difference (2nd ed.). McGraw-Hill.
American Sociological Association. (2020). Comparative/historical approaches. https://www.asanet.org/topics/comparativehistorical-approaches
Pew Research. (2018, April 5). Record 64 million Americans live in multigenerational households. https://www.pewresearch.org/fact-tank/2018/04/05/a-record-64-million-americans-live-in-multigenerational-households/
Zinn, Maxine Baca, et al. Diversity in Families. 9th ed, Allyn & Bacon, 2011.
Cherlin, A. (2016). Public and private families. McGraw-Hill.
Morin, A. (2019, August 19). Individualistic cultures and behavior. Verywell Mind. https://www.verywellmind.com/what-are-individualistic-cultures-2795273
Collectivist and individualist cultures | Psychology Wiki | Fandom. Retrieved December 29, 2019, from https://psychology.wikia.org/wiki/Collectivist_and_individualist_cultures –
Image Description for Figure 1.5:
For children, growing diversity in family living arrangements (1960, 1980, and 2014)
Bar chart visualizing the data in the following table:
| Family Structure | 1960 | 1980 | 2014 |
|---|---|---|---|
| Two parents, first marriage | 73% | 61% | 46% |
| Two parents remarried | 14% | 16% | 15% |
| Single parent | 9% | 19% | 26% |
| No parent | 4% | 4% | 5% |
| Cohabiting parent | N/A | N/A | 7% |
Notes: Data regarding cohabitation are not available for 1960 and 1980. In those years, children with cohabiting parents are included under “single parent.”
Data source: Pew Research Center analysis of 1960 and 1980 Decennial Census and 2014 American Community Survey (IPUMS). https://www.pewresearch.org/social-trends/2015/12/17/1-the-american-family-today/
Designed by Elizabeth Pearce and Michaela Willi Hooper, Open Oregon Educational Resources, CC BY 4.0.
Image Description for Figure 1.6:
Median Age at First Marriage: 1890 – 2022
Line chart from the US Census Bureau shows age at first marriage.This dipped down from 26 for men and 22 for women in 1890 to about 20 for women and 22 for men in the 1950s and ‘60s. The lines then rise quickly to 2020, when there is again a slight dip downwards. In 2022, the median age of first marriage was about 30 for men and 28 for women.
Source: US Census Bureau, Decennial Census, 1890-1940, and Current Population Survey, Annual Economics Supplements, 1947-2022. Note: Starting in 2019, estimates for marriage now include same-sex married couples.
Image Description for Figure 1.7:
Marriage and Divorce Rates, United States, 1990-2020
Rate per 1,000 total population. Bar chart of marriage and divorce rates.
Data table:
| Year | Marriage Rate | Divorce Rate |
|---|---|---|
| 1990 | 9.8 | 4.7 |
| 1995 | 8.9 | 4.4 |
| 2000 | 8.2 | 4.0 |
| 2005 | 7.6 | 3.6 |
| 2010 | 6.8 | 3.6 |
| 2015 | 6.9 | 3.1 |
| 2020 | 5.1 | 2.3 |
Data sources:
National marriage and divorce rate trends for 2000-2020 (https://www.cdc.gov/nchs/nvss/marriage-divorce.htm) and Monthly Vital Statistics Reports (https://www.cdc.gov/nchs/products/mvsr.htm). Recent data are provisional. See CDC sources for full notes.
Design by Elizabeth Pearce and Michaela Willi Hooper. Open Oregon Educational Resources.
Image Description for Figure 1.9:
People in the U.S. Living in Multigenerational Family Households Quadrupled Between 1971 and 2021
A bar chart shows that the number of people living in multigenerational households (represented in millions) increased steadily from around 15 million in 1971 to 60 million in 2021.
Notes:
Data are represented in ten year intervals. Multigenerational households include at least two generations of adults mainly 25 and older or grandparents and grandchildren younger than 25.
Data source:
“Financial Issues Top the List of Reasons U.S. Adults Live in Multigenerational Homes,” Pew Research Center analysis of Current Population Survey Annual Social and Economic Supplement (ASEC) data files for 1971, 1981, 1991, 2001, 2011, and 2021(IPUMS).
Design by Michaela Willi Hooper and Elizabeth Pearce, Open Oregon Educational Resources, CC BY 4.0.