
10.3 Equitable Access to Food
What causes some families to be hungry, or the more technical term, food insecure? We acknowledge that food insecurity is a symptom of another social problem: poverty. First, let’s look at some of the systems that affect food availability in the United States.
Equitable access to food is hampered by governmental systems that focus on subsidizing specific farm crops. Federal government subsidies help farmers reduce their risk due to weather, commodities brokers, economic downturns, and changes in demand. There are only five crops that receive these major government subsidies: corn, soybeans, wheat, cotton, and rice. Producers of fruit, vegetables and meat only benefit from crop insurance and disaster relief (Amadeo, 2020). Farm subsidies have increased dramatically in the last four years, totaling $28 billion dollars for a two year period (2018–2020, not including the additional Coronavirus payments authorized in the spring of 2020) (Charles, 2019). This incentivizes the production of certain crops in the United States and provides stability for the families involved in producing those crops.
It is more complicated to measure the effects of these subsidies on consumers. We know that these subsidized food crops (corn, soybeans, wheat, and rice) are more easily stored and utilized in processed foods, which nutritionists advise should be eaten in the smallest amounts. Crops in their raw forms, such as fruits, vegetables, legumes, meat, and dairy products, provide more health benefits but are not subsidized consistently by the government (Figure 10.4). Here we may deduce that governmental subsidies of less healthy crops contribute to food availability and cost, affecting food purchases. Lower income families and those living in food deserts are most affected.

Figure 10.4. Fresh produce is more difficult to store and less likely to be available at food banks.
Another challenge to food accessibility is the societal approach which focuses on governmental programs (such as the Supplemental Nutrition Assistance Program—SNAP) and charity, which in itself has become a business. Grocery stores and other businesses are provided with tax benefits when they overproduce food and donate it to food banks. Andy Fisher, the author of Big Hunger, describes hearing from grocery store owners who acknowledge the overproduction of sheet cakes, birthday cakes, pastries, and other baked goods. Consumers do not wish to purchase the last cake on the shelf, and so stores overproduce these items. When they are no longer considered fresh, they are donated to food banks. This is one of the reasons that about 25 percent of the donations that Food Banks give away consist of food that is categorized as unhealthy (Hemmelgarn, 2013). Listen to Fisher describe the complexities of this cycle in this podcast where he discusses charitable giving, hunger, and poverty.
Not only is overproduction of food supported by tax deductions, but food banks themselves have become multimillion dollar businesses. Food banks serve a charitable purpose that meets an immediate and important need. At the same time, if the real problem—poverty—were addressed, people could have the dignity of providing and choosing the food that is best for their own family.
Poverty affects Americans of every racial-ethnic group, including those descended from European immigrants, but continues to affect the previously mentioned groups (Native Americans, Black or African Americans, and people descended from Latin America and some Asian countries) in disproportionately larger numbers (U.S. Census Bureau, 2013). The United States is an individualistic country and people are sometimes blamed for being poor. This makes the problem of hunger more approachable than the problem of poverty. It is encouraging to note, however, that Americans increasingly understand that poverty stems not from personal shortcomings, but from differentiation in circumstance and opportunity. Pew Center survey results released in March, 2020, note that almost ⅔ of American adults say that people who are rich have experienced more advantages than those who are poor; only ⅓ say that it is because rich people have worked harder. These viewpoints are unevenly related to political affiliation and age, with Democrats and younger people more likely to hold the majority view (Pew Research Center, 2020). If more people view poverty as a social problem than a personal problem, it is more likely to be solved with a systemic solution.
10.3.1 Food Deserts
Food deserts are geographic locations where there is not a variety of healthy food readily available (within a mile in urban environments or within 10–20 miles in a rural area). Food deserts occur nationally, with a greater concentration of food deserts in the Midwest and southern states.
Think about the community that you live in. Where are the grocery stores? Convenience stores don’t count, because they do not typically have fresh fruits and vegetables (Figure 10.5), although they do sell other items that are food stamp eligible. Are the stores evenly spaced out amongst the neighborhoods? Probably not, and typically the scarcity of stores is in lower income neighborhoods. The same parts of Portland, Oregon that are identified as redlined neighborhoods in the Housing chapter are also food deserts. The Oregon State University (OSU) student newspaper, The Daily Barometer, wrote about food deserts in Corvallis, Oregon, in 2019, pointing out that the majority of grocery stores in Corvallis are clustered around 9th Street and Walnut Boulevard (Shelby, 2019). Two of the four stores that are more distantly spaced are among the healthiest, emphasizing organic produce and natural foods, but also the most expensive.
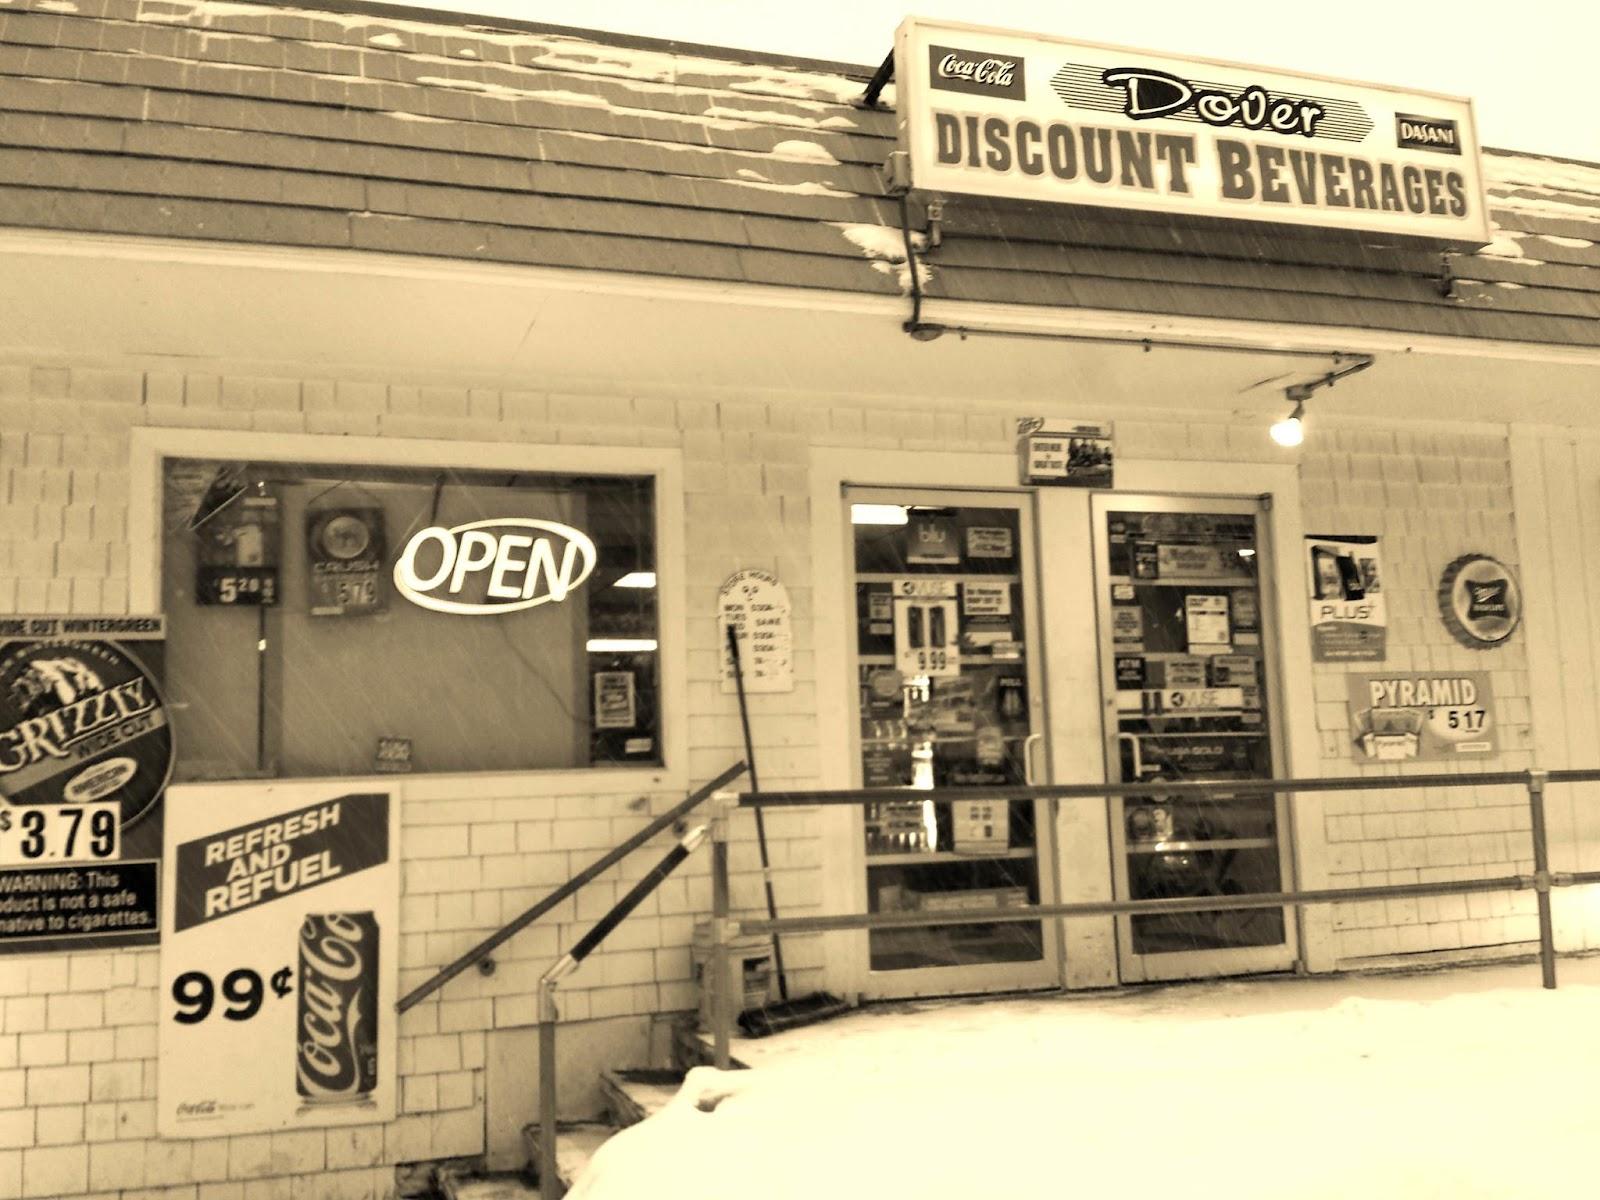
Figure 10.5. Convenience Stores such as this one don’t count as grocery stores because they do not sell the healthy fresh foods that nutritionists recommend.
What if there were federal funding to support equitable distribution of grocery stores that had a full selection of healthy foods? In the same way that federal subsidies protect farmers of selected crops from economic problems, they could protect grocery businesses and create greater equity for many consumers.
10.3.1.1 In Focus: The “Gangsta Gardener”
How can individuals and families impact the trends toward large commercial farms and likelihood that foods are transported thousands of miles rather than being available fresh, locally? One example of someone who is making a difference is Ron Finley, a proponent of urban farming. Formerly best known as a fashion designer for high-end stores and celebrities, he now calls himself the “Gangsta Gardener” after digging up a strip of earth between his house and the street to plant fruits and vegetables. It turned out that this was illegal in the city of Los Angeles so Finley worked to change the law (Figure 10.6).
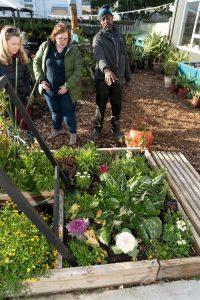
Figure 10.6. Ron Finley has inspired people locally and globally to use urban spaces to grow healthy food.
Since that time he has helped hundreds of families start their own gardens and given a TED Talk watched by 4.2 million people as of 2022. An article in The Guardian described Finley this way:
He has traveled widely talking about his work, including a TED Talk watched by 3.5 million people (that’s where his nickname comes from, when he says: “Let’s all become gangsta gardeners … If you ain’t a gardener, you ain’t gangsta”). He likens his work to graffiti, describing Mother Nature as the greatest artist out there. “We did it in LA and we can do it all over the world … A garden can change people’s lives, it can change the destruction of a community,” he says in Can You Dig This?, a 2015 documentary about community gardens in South Central, which has music star John Legend among its executive producers (Weston, 2020.)
Finley emphasizes the importance of opportunity as opposed to hope, “It’s the opportunity to make shit happen…A lot of the governments and municipalities need to put money into this, which they haven’t,” he says.
10.3.2 The Poverty Line and Food Costs
How is poverty defined? While there are multiple measures, a common and shared one is the poverty threshold, also known as the poverty line. While poverty will affect all of the families related to all of the topics in this text, we will discuss it here because it was originally tied to the cost of food, specifically an “economy food plan.” In 1963, the poverty line was designated at three times the economy food plan, and it was assumed “that the housewife will be a careful shopper, a skillful cook, and a good manager who will prepare all the family’s meals at home” (Fremstad, 2019).
When U.S. officials became concerned about poverty during the 1960s, they quickly realized they needed to find out how much poverty we had. To do so, a measure of official poverty, or a poverty line, was needed. A government economist, Mollie Orshanky, first calculated this line in 1963 by multiplying the cost of a very minimal diet by three, as a 1955 government study had determined that the typical American family spent one third of its income on food. Thus a family whose cash income is lower than three times the cost of a very minimal diet is considered officially poor.
This way of calculating the official poverty line has not changed since 1963, although the amount is adjusted by inflation. It is thus out of date for many reasons. For example, many expenses, such as heat and electricity, child care, transportation, and health care, now occupy a greater percentage of the typical family’s budget than was true in 1963. In addition, this official measure ignores a family’s non-cash income from benefits such as food stamps and tax credits. As a national measure, the poverty line also fails to take into account regional differences in the cost of living. All these problems make the official measurement of poverty highly suspect. As one poverty expert observes, “The official measure no longer corresponds to reality. It doesn’t get either side of the equation right—how much the poor have or how much they need. No one really trusts the data” (DeParle et al., 2011).
This is a good time to ask yourself, if you looked at food as a percentage of your budget, would it be the equivalent of 33 percent? That’s how the poverty line is still calculated.
The poverty line is adjusted annually for inflation and takes into account the number of people in a family: the larger the family size, the higher the poverty line. In 2010, the poverty line for a nonfarm family of four (two adults, two children) was $22,213. A four-person family earning even one more dollar than $22,213 in 2010 was not officially poor, even though its “extra” income hardly lifted it out of dire economic straits. Poverty experts have calculated a no-frills budget that enables a family to meet its basic needs in food, clothing, shelter, and so forth; this budget is about twice the poverty line. Families with incomes between the poverty line and twice the poverty line (or twice poverty) are barely making ends meet, but they are not considered officially poor (Figure 10.7).
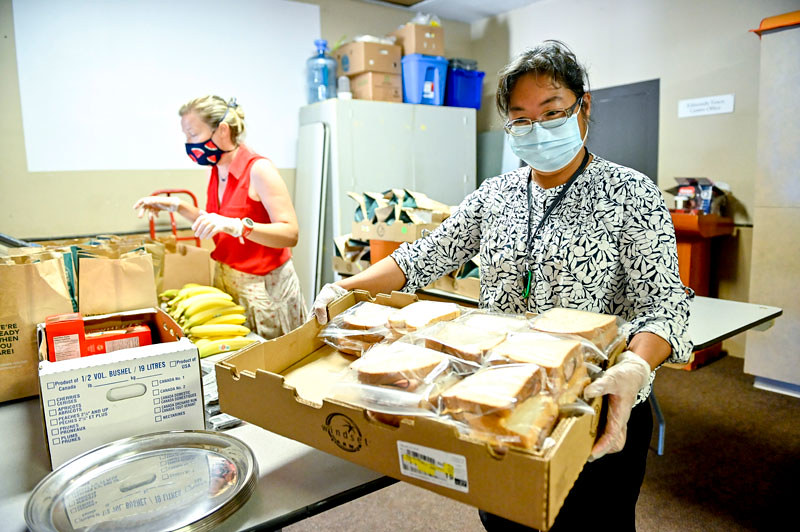
Figure 10.7. Ironically enough, although poverty is measured by an income that is lower than three times the cost of a minimal diet, many families above the poverty line still struggle with having enough food.
When we talk here about the poverty level, then, keep in mind that we are talking only about official poverty and that there are many families and individuals living in near poverty who have trouble meeting their basic needs, especially when they face unusually high medical expenses, motor vehicle expenses, college debt, or the like. For this reason, many analysts think families need incomes twice as high as the federal poverty level just to get by (Wright et al., 2011). They thus use twice-poverty data (i.e., family incomes below twice the poverty line) to provide a more accurate understanding of how many Americans face serious financial difficulties, even if they are not living in official poverty (Anonymous, 2016).
10.3.3 Food Security and Food Insecurity
Identified in 1995 as a measurable problem, the USDA introduced new language to describe ranges of severity of food insecurity in 2006. The methods used to assess households’ food security remained unchanged. Here are the current definitions of food security and food insecurity:
10.3.3.1 Food Security
- High food security: no reported indications of food-access problems or limitations.
- Marginal food security: one or two reported indications—typically of anxiety over food sufficiency or shortage of food in the house. Little or no indication of changes in diets or food intake.
10.3.3.2 Food Insecurity
- Low food security (Food insecurity without hunger): reports of reduced quality, variety, or desirability of diet. Little or no indication of reduced food intake.
- Very low food security (Food insecurity with hunger): Reports of multiple indications of disrupted eating patterns and reduced food intake. (Economic Research Service, 2019)
According to the USDA, hunger “… refer(s) to a potential consequence of food insecurity that, because of prolonged, involuntary lack of food, results in discomfort, illness, weakness, or pain that goes beyond the usual uneasy sensation.” Nationally, food insecurity has been a problem as long as it has been measured and the rate has changed very little; the number of food insecure families was 12 percent in 1995 and was still 11.1 percent in 2018. Let’s look more closely at Oregon, where food insecurity has been one of the toughest challenges to overcome. According to the Oregon Public Health Division, Oregon ranks 13th in the nation for food insecurity among children, and 21st for adults. While efforts have been made to combat hunger in Oregon, it is still a big problem for the state. According to USDA data, more than one in seven of Oregon households were food insecure between 2014 and 2016 (Bauer, 2018). Renters in Oregon had food insecurity rates as high as one in four between 2015–2017 (Edwards, 2018).
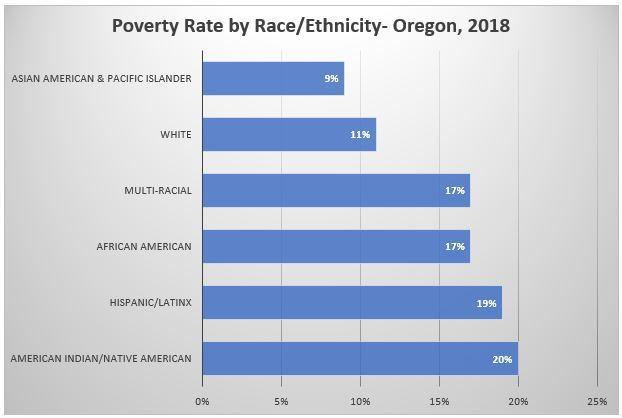
Figure 10.8. Poverty rate by race/ethnicity, Oregon, 2018.
The Oregon Center for Public Policy says that over 527,000 people in Oregon suffer from food insecurity (Bauer, 2018).
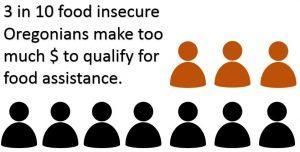
Figure 10.9. Share of food insecure Oregonians with too much income to qualify for SNAP assistance, 2016.
To put that into perspective, the population of Portland, our largest city, is around 647,800 people. Overall, minorities and single mothers are disproportionately impacted by food insecurity; food insecurity is strongly linked to socioeconomic status.
While there are programs to help families who are food insecure, there are still families who are food insecure who do not qualify for any food assistance (Figure 10.8).
10.3.3.3 Case Study: Food Insecurity at Linn-Benton Community College
In a recent survey conducted by the HOPE Center at Temple University, Linn-Benton Community College (LBCC) in Albany, Oregon was one of 400 community colleges queried about food and housing insecurity over the past five years. Linn-Benton Community College students participated in 2019, the fifth year of the study. The survey was sent to 5,700 students and 558 students responded.
Forty-eight percent of students reported experiencing food insecurity within the last 30 days, slightly higher than the nation-wide average of community college students (Figure 10.10).
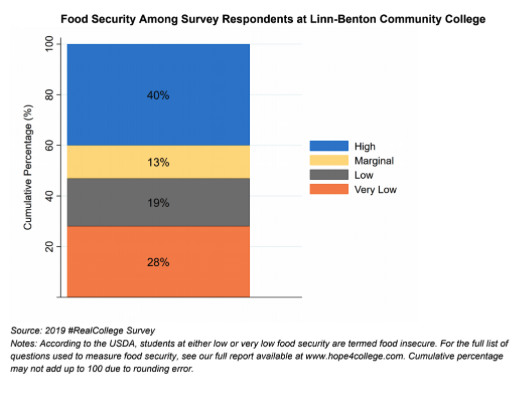
Figure 10.10. Forty-seven percent of student respondents at LBCC are food insecure.
Sixty-six percent of the students that participated in the survey reported experiencing either food insecurity, housing insecurity, or houselessness within the past year (Baker-Smith et al., 2020). Various measures of food insecurity ranged in response from five to 49 percent of LBCC students (Figure 10.11).
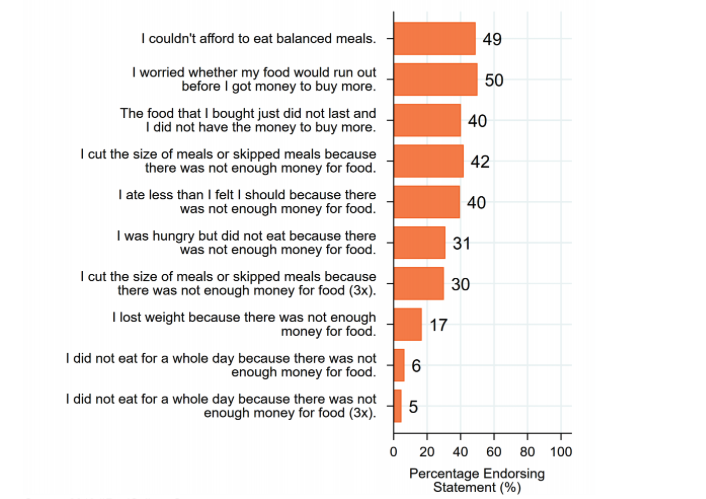
Figure 10.11. Food insecurity as measured in a variety of ways appears among survey respondents at LBCC.
10.3.4 Food Stamps
Many people in the United States rely on the Supplemental Nutrition Assistance Program (SNAP) to provide food for their families. SNAP, also known as food stamps, is a federal program that in some states is supplemented with local funds whose goal is to supplement nutrition and the food budget of families who are moving toward self-sufficiency. According to the 2018 American Community Survey, 12.4 percent of people in the United States use food stamps and the majority of those families have at least one person working, with ⅓ of recipients having two family members working (US Census Bureau, 2020). Oregon has one of the highest usage rates in the country at a rate of fourteen percent. Here you can see a map of SNAP usage across the country.
Many people on SNAP still have trouble making ends meet. Many people find themselves stuck in a seemingly endless cycle of poverty, despite striving for self-sufficiency. Listen here to a 3-minute summary of an interview with a woman in 2000 when she used food stamps and then re-interviewed in 2012.
Fraud is often mentioned as a concern when it comes to food stamps, but when recipient and vendor fraud is totaled it is estimated at less than one percent of all funds disbursed. That means that more than 99 percent of the funds are used correctly (Constable, 2018). The USDA maintains a webpage that reports on their efforts to stop fraud and to recoup delinquent funds. These authors advocate for the focus to shift toward solving the social problems of poverty and hunger, rather than letting the small amount of fraud distract the country from these efforts.
People struggling to feed themselves and their families face other challenges as well. Accepting governmental assistance and charity is stigmatized. Some families feel too embarrassed to seek or accept needed resources. Constant stress related to food insecurity and choosing which bills to pay contributes to mental health challenges. Do you or someone you know have experience with using SNAP? Click here to read Voices From ‘Hunger In Oregon’ for short descriptions from Oregonians who have used this program.
10.3.5 Licenses and Attributions for Equitable Access to Food
10.3.5.1 Open Content, Original
“Procuring Food” by Elizabeth B. Pearce and Amy Huskey is licensed under CC BY 4.0, unless otherwise noted below.
Figure 10.8. “Poverty rate by race/ethnicity, Oregon, 2018.” Based on data from the American Community Survey/Kaiser Family Foundation. License: CC BY 4.0.
Figure 10.9. “Share of food insecure Oregonians with too much income to qualify for SNAP assistance, 2016.” Based on data from the Oregon Center for Public Policy. License: CC BY 4.0.
10.3.5.2 Open Content, Shared Previously
“The Poverty Line and Food Costs” is adapted by Elizabeth B. Pearce and Amy Huskey from Social Problems: Continuity and Change by Anonymous. License: CC BY-NC-SA 4.0.
Figure 10.4. “kitchen remodel: 1927 Mission Revival bungalow” by jlt. License: CC BY-NC-SA 2.0.
Figure 10.5. “Food Desert Challenge: Day 1” by Mark Bonica. License: CC BY 2.0.
Figure 10.6. The Gangsta Gardener, Ron Finley, August 17-20, 2018 by U.S. Embassy, New Zealand in the public domain.
Figure 10.7. “Funding helps people facing food insecurity” by Province of British Columbia is licensed under CC BY NC ND 2.0.
10.3.5.3 All Rights Reserved
Figure 10.10. “Food security among survey respondents at Linn-Benton Community College” in #2019 RealCollege Survey: Linn-Benton Community College by The Hope Center. Used with permission.
Figure 10.11. “Food insecurity among survey respondents at Linn-Benton Community College” in #2019 RealCollege Survey: Linn-Benton Community College by The Hope Center. Used with permission.
10.3.6 References
Weston, P. (2020, April 28). “This is no damn hobby”: The “gangsta gardener” transforming Los Angeles. The Guardian. https://www.theguardian.com/environment/2020/apr/28/ron-finley-gangsta-gardener-transforming-los-angeles