
8.4 Finding a Home: Inequities
Elizabeth B. Pearce, Carla Medel, Katherine Hemlock, and Shonna Dempsey
Finding a place to call “home” is important. Living in a place that supports access to outdoor spaces, a feeling of security, effective schools, transportation, food and other resources and the potential for community are quality factors that affect a family’s abilities to function effectively and efficiently. We might call these “livable environments.”
Home ownership has been and is still the most basic and viable way to accrue wealth in the United States. Access to home ownership is important to families for both livability and financial investment purposes. Uncovering the inequities in access to home ownership is critical to understanding the well-being of families in the United States.
8.4.1 Power and the American Dream: Home Ownership Versus Renting
The government and financial organizations both hold substantial power in the United States. Together, they affect how homes are purchased and who can purchase them. Although we know that race is a social construction, it is still used as an identifying feature for families, and has been used by these systems to control home purchases and to segregate living areas. We will discuss housing from the perspective of racial-ethnic groups affected by these regulations and practices.
Families that rent homes rather than buy are on the increase; more people are renting now than at any time in the last fifty years. This is not due to lack of desire to own a home; in a 2016 Pew Research Center Survey, 72 percent of renters said that they desire to own a home (Cilluffo et al., 2017). Denial rates for mortgages continue to be higher for Black and Hispanic applicants. When they are approved, they tend to have higher monthly payments, which increases the cost burden on families. This is typically due to having fewer financial resources with which to make a down payment (Desilver & Bialik, 2017).
8.4.2 Historic Discrimination and Today’s Effects on Families
While it may be obvious that home ownership increases stability and enables individuals and families to accrue wealth, it is also true that home ownership has a significant effect on the life satisfaction of low-income people. Home buyers have been found to have higher levels of life satisfaction and may also have increased self-esteem and a sense of control compared to renters (Rohe & Stegman, 1994). It is impossible to talk about lower rates of home ownership among minoritized groups without discussing the practices of intentional segregation and gouging enacted by the federal government, lending institutions, local governments, and housing covenants following the legal end of slavery in the United States. Figure 8.8 is an example of signage from this time period.’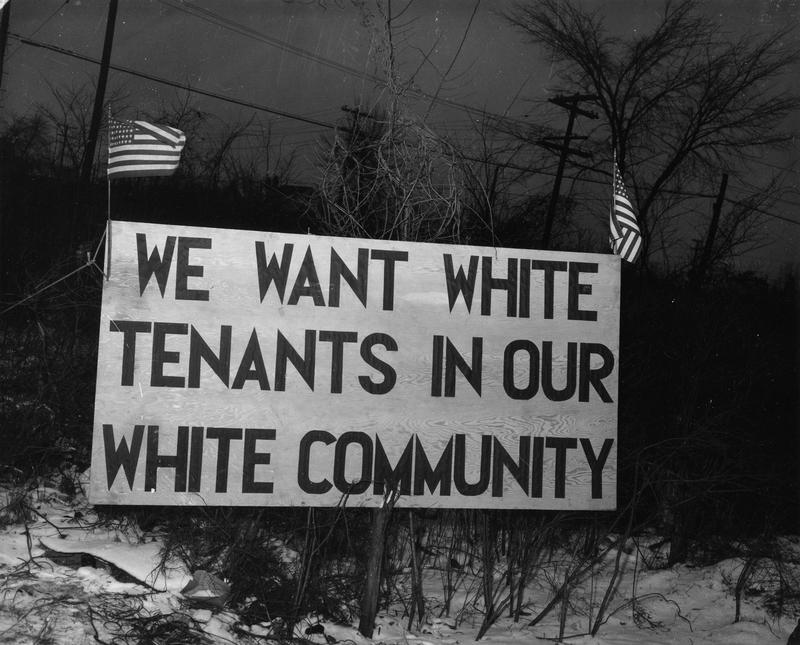
Figure 8.8. Segregated neighborhoods did not come about organically, but through deliberate planning of policies and practices.
8.4.2.1 Redlining
Redlining is the discriminatory practice of refusing loans to creditworthy applicants in neighborhoods that banks deem undesirable or racially occupied. Although homeownership became an emblem of American citizenship and the American dream during the 20th century, Black families and other marginalized populations were specifically limited in their abilities to purchase homes. Both the federal government, which created the Home Owners’ Loan Corporation in 1933 and the Federal Housing Association (FHA) in 1934, along with the real estate industry, worked to segregate White neighborhoods from other groups in order to preserve property values.
Lending institutions and the federal government did this by creating maps in which the places where people of color and/or foreign-born individuals lived were colored red (Figure 8.9). Then those areas were designated to be “dangerous” or “risky” in terms of loaning practices. Because families in these same groups were often denied access to the neighborhoods designated to be “good” or “the best” they were forced to take loans that required higher down payments and/or higher interest rates.
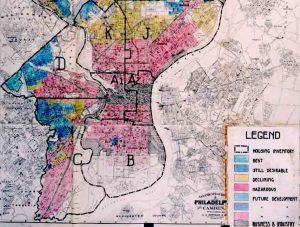
Figure 8.9. Lending institutions and the federal government created maps in which the places where people of color and/or foreign-born lived were colored red.
The Home Owners’ Loan Corporation, which regulated home loans, created residential security maps divided into four different categories:
- Green: “The best” for businessmen
- Blue: “Good” for white-collar families
- Yellow: “Declining” for working-class families
- Red: “Detrimental” or “Dangerous” for “foreign-born people, low-class whites, and negroes”
These ratings indicated to lending institutions how “risky” it was to provide loans by area. It was then less likely that loans could be secured in the red and yellow neighborhoods; interest and payments would be higher. Unscrupulous private lenders used this opportunity to create unfair practices such as unreasonably high payments with devastating consequences if one payment or partial payment was missed, such as the Black homeowner losing their home and all equity that had been earned (Coates, 2014).
In 1968, these practices were outlawed by the Fair Housing Act, which was part of the Civil Rights Act. The Fair Housing Act is an attempt at providing equitable housing to all. It makes discriminating against someone based on skin color, sex, religion, and disability illegal. Also banned is the practice of real estate lowballing, where banks underestimate the value of a home, in effect forcing a borrower to come up with a larger down payment to compensate for the lower loan value. The offering of higher interest rates, insurance, and terms and conditions to minority loan applicants is illegal. Denying loans and services on the basis of an applicant’s protected class is also illegal.
Still, much damage was done prior to its passage. For decades, the federal government poured tax monies into home loans that almost exclusively favored White families. Home ownership is the most accessible way to build equity and wealth and it was denied to many minority families for decades. Once the Fair Housing Act passed, local governments, residential covenants, and deed modifications continued to discriminate well into the 2000s, and families in marginalized groups still had less success in achieving home loans.
The result of these institutionalized efforts resulted in residential segregation, the physical separation of two or more groups into different neighborhoods. Many times this form of segregation is associated with race, but it can also be associated with income. Segregated neighborhoods did not come about organically, but through deliberate planning of policies and practices that have systematically denied equal opportunity to minority populations. Segregation has been present in the United States for many years, and while now it is illegal to do so, it has been institutionalized in neighborhood patterns (Figure 8.10). From information collected in the 2010 census, we see that a typical White person lives in a neighborhood that is 75 percent White and 8 percent African American, while a typical African American person lives in a neighborhood that is 35 percent White and 45 percent African American (Frey, 2020).
Figure 8.10. Housing Segregation and Redlining in America: A Short History | Code Switch | NPR [YouTube Video]. This video provides a summary of housing segregation in the U.S.
8.4.2.2 In Focus: Residential Segregation in Oregon
As a recipient of federal funding, the city of Portland, Oregon, is required to abide by the rules of the Fair Housing Act, but like many cities in the United States, Portland has a history of redlining and other discriminatory practices. In order to better understand Portland’s practices, learning about Oregon’s history is useful. Black exclusion laws were put in place when the state was founded in order to discourage people of color from settling in Oregon.
Between 1900 and 1930, Portland began zoning practices, the act of separating land based on what it will be used for, such as residential, industrial, and commercial. In 1924, Portland approved its first zoning code with the following zones:
- Zone 1–Single-Family
- Zone 2–Multifamily
- Zone 3–Business-Manufacturing
- Zone 4–Unrestricted
Most residential areas were designated Zone 2, except for 15 neighborhoods considered the “highest quality” that were designated Zone 1 (Hughes et al., 2019).
Between the 1930s and ’40s, Portland City Council rezoned large areas of multifamily zoning to single-family zoning (Figure 8.10). This was done to protect real estate values of single-family homes and make it easier for homeowners to obtain Federal Housing Administration loans in those areas. During this time, roughly 14.25 square miles was rezoned from multifamily to single-family housing. This was used as a tool to further reinforce racial segregation by restricting federal and private lending. It made it difficult, sometimes even impossible, for residents living in “redlined” neighborhoods to receive residential and commercial loans.
Neighborhood planning from 1960 to 1970 included the ideas of residents instead of only the real estate industry.Although many strong neighborhood associations formed, power continued to reside with the more affluent, mostly White neighborhoods, and the 1980 Comprehensive Plan favored expanding and protecting single-family zones.
Figure 8.10. Portland has failed to create more mixed neighborhoods.
In 1994, the Community and Neighborhood Planning Program was adopted to address issues that sprouted after the Comprehensive Plan. With this they did the opposite of what had been done for many years in the past by expanding the multifamily zones. The program sought to expand and intermix multifamily housing, but it was met with resistance and controversy that led to uneven results.
VisionPDX came forward in 2005 as an effort to engage community members, especially those from underrepresented communities, in developing a shared vision of Portland. They wanted to focus on providing an opportunity for input to those who previously had no say in the future of Portland. This new way of thinking about equity led to the development of new goals and policies in the most updated version of the Comprehensive Plan in 2016.
Today, single-family zoning accounts for approximately 74 percent of the total land area for housing in Portland. Since the 1920s, very little change has occurred with the original 15 single-family zones. These neighborhoods have remained stable and demographically homogeneous with low levels of vulnerability to displacement and tend to be the zones for White households. Similarly, the zones originally designated as less desirable are homes for many families from marginalized groups, and contain fewer resources and amenities desired by families.
So what can we learn from this? Portland’s land use planning history, intentional or not, has resulted in discrimination and segregation. These planning practices and the decisions made have predominantly benefited and privileged White homeowners while communities of color have been burdened, excluded, and displaced. Decision-making for collective improvement is often complicated when it affects individual outcomes. The same people who may believe in equity may also resist change when they perceive that it affects them individually. This is called the “Not in my Backyard” (NIMBY) phenomenon and likely affected Portland’s failure to move toward creating more mixed neighborhoods. Portland and all cities can do better. Fair housing regulations can be achieved by understanding the history and then creating policy change which will lead to more equitable outcomes.
8.4.2.3 Bluelining
Bluelining is a current banking and lending issue related to rising water levels that are a product of climate change. Real estate that is considered high risk due to low elevation and/or proximity to a floodplain may not qualify for loans. With the current rate of ocean warming, sea levels are expected to rise and warm water will generate storms that displace millions of people in the United States and worldwide (Figure 8.12). Climigration, a newly coined word that combines “climate” and migration, describes the act of people relocating to areas less devastated by flooding, storms, drought, lack of clean water or economic disaster due to the forces of climate change.
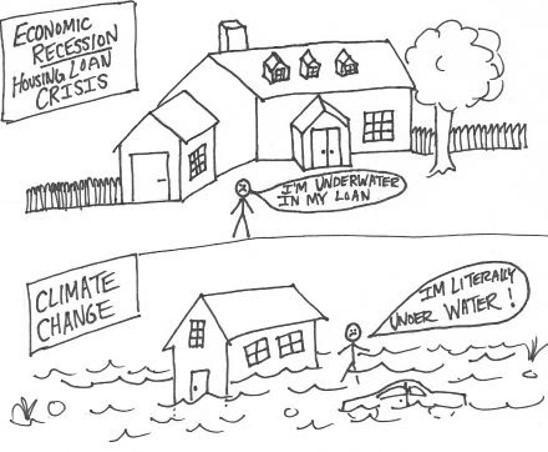
Figure 8.12. Homes at risk of being destroyed due to river, ocean, or storm flooding could lose value in the housing market.
Many American families relocate as jobs disappear or land becomes flooded or arid. In response to immediate disaster, many families move to live with relatives or friends. Some families have nowhere to turn. The 2018 Annual Homeless Assessment (AHAR) to Congress reported that 3,900 people were staying in sheltered locations specifically for people displaced by presidentially declared national disasters. They were displaced from areas struck by Hurricanes Harvey, Irma, Maria, and Nate; western wildfires; and other storms and events (Henry, Mahathey, Morrill, Robinson, Shivji, & Watt,2018)” (Henry et al., 2018).
Climate change has also changed the economic desirability of entire regions, creating a new divide between the poor and the privileged. In the Southern California region of Los Angeles, shade has become an increasingly precious commodity, giving respite from the searing heat that bakes the community during longer, hotter warm seasons.
In the 1950s, the lure of the California sunshine attracted settlers from across the U.S. to propel LA into a major metropolis. Now, shade provided by large tree-lined neighborhoods and areas of upscale urban design are enjoyed by the affluent but absent for those who need it the most. There is a public health benefit from trees, with studies showing benefits like lower asthma and improved mental health for those exposed to greenspaces. The accessibility of greenspaces is proving to have a direct impact on health (Figure 8.13).

Figure 8.13. The accessibility of greenspaces is proving to have a direct impact on health.
People who live in less desirable neighborhoods and use public transportation also wait at the more than 750 bus stops where police ordered the removal or minimization of trees in an earlier era as shown in Figure 8.14. To learn about an inventive solution to this problem, read about Urban Farming: The “Gangsta Gardener” in Chapter 10. They spend more time outdoors traveling to jobs and needed resources and suffer the highest heat index (Arango, 2019).
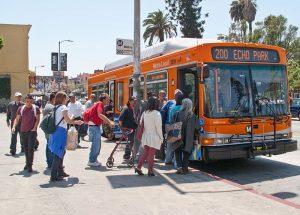
Figure 8.14. People who live in less desirable neighborhoods and use public transportation suffer the highest heat index.
8.4.2.4 Environmental Factors
Environmental factors, such as proximity to industry and landfills also affect quality of life. In the U.S the recycling rate of plastics is only 5 to 6 percent as of 2021, while at the same time generation of plastic waste per capita has increased by 263 percent since 1980. While paper, cardboard, and metal are recycled at higher rates, Plastic recycling has never reached 10 percent. Most of the plastics end up in harmful areas like landfills, incinerators, and areas that were not planned like waterways (Fox, 2022).
Landfills continue to fill up as we produce more and more plastic waste. Those who make enough money to live in areas with funding for infrastructure can avoid living near landfills and plastic waste. Those who don’t have enough can’t afford to make these choices and end up disproportionately affected by plastics. This includes having to purchase bottled water, when tap water is unsafe to buy as well as living near waste disposal sites (Jones, 2022). Forty percent of the United State’s total landfill capacity and sixty percent of the largest commercial hazardous waste landfills are in communities that are predominantly families with marginalized identities. (Bullard,n.d.)
Change is challenging; those who are faced with the negative consequences of this waste are not the same who are benefiting financially. Change is unlikely without economic incentives for corporations to use more easily recyclable and less mixed materials, as it is cheaper to dispose rather than recycle.(STINA, 2021). A federal bill has been proposed: The Environmental Justice for All Act. “This bill establishes several environmental justice requirements, advisory bodies, and programs to address the disproportionate adverse human health or environmental effects of federal laws or programs on communities of color, low-income communities, or tribal and indigenous communities.”(Congress, 2022). While promising, this bill has not yet been passed by the US Congress.
8.4.2.5 Reservation Land and Home Ownership
There is another group of families for whom it is more complicated and limited to build capital via home ownership: Native Americans who reside on reservations. When the United States government sequestered Native Americans to reservation lands, it also retained ownership of that land, creating a “ward: guardian relationship” between the government and the Indian Nations, as characterized by Supreme Court Chief Justice John Marshall in 1831 (Cherokee Nations v. Georgia, 1831). The government holds reservation lands “in trust” for the tribe nations.
While there is much public debate about other aspects of tribal rights such as casinos,
and the effects of using Native images and names for sport teams, there is little discussion at the legislative level about the ways the U.S. government has limited the abilities of Native Americans to own property within the communities where they live (Schaefer Riley, 2016). This most basic way of building equity in a country that values individualism and capitalism has been restricted for the people who have inhabited it the longest. Native Americans have the highest poverty rate of any racial-ethnic group (28 percent in 2015) and it is likely that the control the government has exerted over their living conditions contributes to this circumstance (U.S. Census Bureau, 2015).
8.4.2.6 Fair Housing Act
What legally constitutes a family has influenced a multitude of the availability of resources and within that bubble of needs, housing is one of them. Housing distribution appears to have always been a necessity that was historically discriminatory towards marginalized groups regarding social identities such as race, sexual orientation, gender and sex, country of origin, and disability. The Fair Housing Act passed in 1968 originally banned the sale and rental of housing (and other housing practices) indicating preference or discrimination based on race, color, religion or national origin. In 1974, it was amended to include sex, and in 1988, people with disabilities and people with children. To date, it does not include gender identity or sexual orientation. Only a handful of states have made it illegal to discriminate based on sexual orientation and gender identity, and that creates a challenge for LGBTQ+ couples.
8.4.2.7 The Role of Stigma in Obtaining Housing
It is important to note the critical nature of stigma. When a characteristic or behavior is devalued in society, and negative labels are applied to people, the consequences that the labels create can have lasting effects. The labeling theory is a “sociological hypothesis that claims that by describing an individual in terms of particular behavioral characteristics may have a significant effect on his or her behavior, as a form of self-fulfilling prophecy. ”Being called “homeless,” “drug-addict,” “unemployable,” can cause the persons being called these things to self-fulfill the negative labels. Because people of color, LGBTQ+ kinship groups, immigrant families, and others have been stigmatized, they are more likely to then be given other negative behavior-based labels (American Psychological Association, n.d.). This is an example of how society can perpetuate things such as houselessness and criminality without awareness of doing so.
8.4.2.8 Families Who Rent
Decision-making about rental rates, whom to rent to, and upkeep of the home resides with the owner. People who rent, while receiving variable rights and responsibilities dependent on the municipality in which they reside, have less control over their living space than do owners. While many owner-renter relationships are mutually beneficial, renters who live at or below the poverty line have fewer choices and are more likely to encounter landlords who are inattentive or worse.
8.4.2.9 Slumlords
A slumlord, a property owner who does not properly or ethically manage their rental properties, especially one who makes an excess or unfair profit, benefits from renting substandard property to people who have few options. Properties found in low-income areas are more susceptible to having owners who may take advantage of the renters (Figure 8.15). Families who cannot rent anywhere else utilize this type of housing, because the rent is less expensive, and there may be fewer requirements such as background checks. These may include those with criminal records, previous evictions, or issues with paying rent on time.
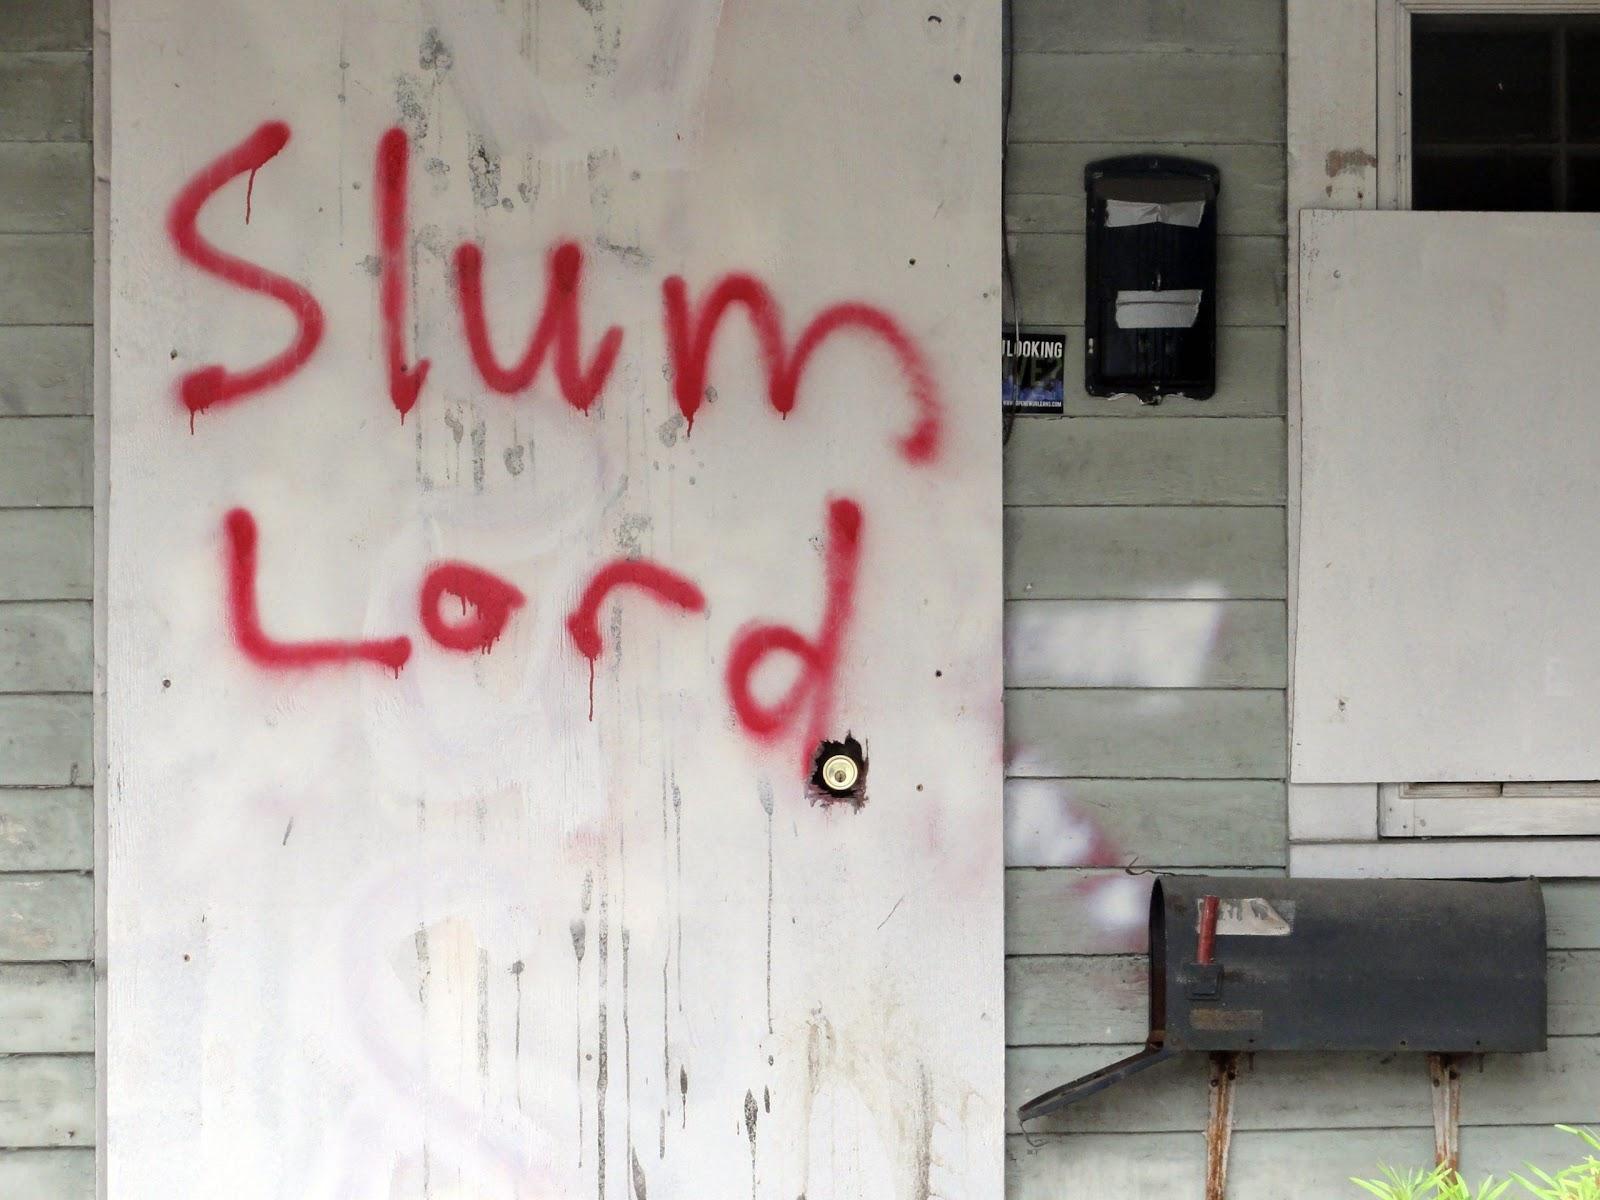
Figure 8.15. Homes owned by “slum lords” are typically in low-income areas.
8.4.2.10 Section 8 Housing
The housing choice voucher program, more commonly known as Section 8 housing, is the federal government’s program for assisting low-income families, the elderly, and the disabled to afford housing. An important thing to notice is how since housing assistance is provided on behalf of the family or individual, participants themselves are able to find their own housing.
Housing choice vouchers are administered locally by public housing agencies (PHAs). The PHAs receive federal funds from the U.S. Department of Housing and Urban Development (HUD) to administer the voucher program. A housing subsidy is paid to the landlord directly by the PHA on behalf of the participating family. The family then pays the difference between the actual rent charged by the landlord and the amount subsidized by the program. Sometimes, a family could even use its voucher to purchase a home with a PHA’s authorization (U.S. Department of Housing and Urban Development, n.d.).
Qualifying for Section 8 housing is not a guarantee of moving into affordable housing. In 2020, the median wait time for people who have applied for a housing voucher in the United States is 1.5 years, with some waits as long as seven years. Currently in Oregon there are thirteen open waiting lists and at least seven counties where families cannot even get on a waiting list (Affordable Housing Online, n.d.).
8.4.3 Licenses and Attributions for Finding a Home: Inequities
8.4.3.1 Open Content, Original
“Finding a Home: Inequities” by Elizabeth B. Pearce, Carla Medel, and Katherine Hemlock, with the exceptions following, is licensed under CC BY 4.0.
“Environmental Factors” by Dominc Church is licensed under CC BY 4.0.
“Slumlords” by Shonna Dempsey is licensed under CC BY 4.0.
Figure 8.12 “Economic & Environmental Irony” by Kate Hemlock. Licensed under CC BY 4.0.
8.4.3.2 Open Content, Shared Previously
Figure 8.8. “Sign: ‘We Want White Tenants in our White Community‘” by Arthur Siegel / Office of War Information. Public domain.
Figure 8.9. “Home Owners’ Loan Corporation Philadelphia redlining map.” Public domain.
Figure 8.10. “Food carts – Portland, Oregon, USA” by Daderot. CC0 1.0 Universal Public Domain Dedication.
Figure 8.13. “Green spaces (4)” by Anthony O’Neil. License: CC BY-SA 2.0.
Figure 8.14. “LA Metro 200 bus stop on Alvarado Street” by Downtowngal. License: CC BY-SA 3.0.
Figure 8.15. “Slum Lord” by Bart Everson. License: CC BY 2.0.
8.4.3.3 All Rights Reserved Content
“Why Cities Are Still So Segregated” (c) NPR. License terms: Standard Youtube License.
8.4.4 References
Cilluffo, A., Geiger, A.W., & Fry, R. (2017, July 19). More US households are renting than at any point in 50 years. Pew Research Center. https://www.pewresearch.org/fact-tank/2017/07/19/more-u-s-households-are-renting-than-at-any-point-in-50-years/
Desilver, D., & Bialik, K. (2017, January 10). Blacks, Hispanics face mortgage challenges. Pew Research Center. https://www.pewresearch.org/fact-tank/2017/01/10/blacks-and-hispanics-face-extra-challenges-in-getting-home-loans/
Rohe, W. M., & Stegman, M. A. (1994). The effects of homeownership: On the self-esteem, perceived control and life satisfaction of low-income people. Journal of the American Planning Association, 60(2), 173–184. https://doi.org/10.1080/01944369408975571
Coates, Ta-Nehisi. (2014, June). The case for reparations. The Atlantic. https://www.theatlantic.com/magazine/archive/2014/06/the-case-for-reparations/361631/
Frey, W. H. (2020, March 30). Even as metropolitan areas diversify, White Americans still live in mostly White neighborhoods. The Brookings Institution. https://www.brookings.edu/research/even-as-metropolitan-areas-diversify-white-americans-still-live-in-mostly-white-neighborhoods/
Hughes, J. et al. (2019, September). Four of these neighborhoods are shown in Figure 8.9. Historical context of racist planning: A history of how planning segregated Portland. Bureau of Planning and Sustainability. City of Portland, Oregon. https://beta.portland.gov/sites/default/files/2019-12/portlandracistplanninghistoryreport.pdf
Nelson, R. K. et al. (n.d.). Mapping inequality: Redlining in New Deal America. University of Richmond. Retrieved March 9, 2020, from https://dsl.richmond.edu/panorama/redlining/
Henry, M., Mahathey, A., Morrill, T., Robinson, A., Shivji, A., & Watt, D. (2018, December). The 2018 Annual Homeless Assessment Report (AHAR) to Congress. U.S. Department of Housing and Urban Development. https://files.hudexchange.info/resources/documents/2018-AHAR-Part-1.pdf
Arango, T. (2019, December 1). Why shade Is a mark of privilege in Los Angeles. The New York Times. https://www.nytimes.com/2019/12/01/us/los-angeles-shade-climate-change.html
Cherokee Nations v. Georgia, 30 U.S. (5 Pet.) 1 (1831)
Schaefer Riley, N. (2016, July 30). One way to help Native Americans: property rights. The Atlantic. https://www.theatlantic.com/politics/archive/2016/07/native-americans-property-rights/492941/
U.S. Census Bureau. (2015, November 2). Facts for Features: American Indian and Alaska Native Heritage Month: November 2015. https://www.sprc.org/resources-programs/us-census-bureau-profile-america-facts-features-american-indian-and-alaskan
National Center for Transgender Equality. (2019, June 9). The Equality Act: What transgender people need to know. https://transequality.org/blog/the-equality-act-what-transgender-people-need-to-know
Washington State Coalition Against Domestic Violence. (n.d.). Building dignity: Design strategies for domestic violence shelter. Retrieved March 9, 2020, from https://buildingdignity.wscadv.org/
American Psychological Association. (n.d.). Labeling theory. In The APA Dictionary of Psychology. Retrieved March 9, 2020, from https://dictionary.apa.org/labeling-theory
U.S. Department of Housing and Urban Development. (n.d.). Housing Choice Voucher Program (Section 8). Retrieved February 21, 2020, from https://www.hud.gov/topics/housing_choice_voucher_program_section_8
Affordable Housing Online. (n.d.). Search low income apartments and wait lists. Retrieved February 21, 2020, from https://affordablehousingonline.com/
STINA. (2021). Assessing the State of Food Grade Recycled Resin in Canada & the United States . Assessing the State of Food Grade Recycled Resin in Canada & the United States. Retrieved December 6, 2022, from www.plasticmarkets.org.
Environmental justice for All-Bullard – University of Kentucky. (n.d.). Retrieved December 6, 2022, from https://www.uky.edu/~tmute2/GEI-Web/password-protect/GEI-readings/Bullard-Environmental%20justice%20for%20all.pdf
Fox, E. (2022, May 4). New report reveals that U.S. plastics recycling rate has fallen to 5%-6%. Beyond Plastics – Working To End Single-Use Plastic Pollution. Retrieved December 6, 2022, from https://www.beyondplastics.org/press-releases/the-real-truth-about-plastics-recycling
Jones, V. (n.d.). The economic injustice of plastic. Van Jones: The economic injustice of plastic | TED Talk. Retrieved December 6, 2022, from https://www.ted.com/talks/van_jones_the_economic_injustice_of_plastic/transcript?language=en