
7.4 Health and Health Insurance
Elizabeth B. Pearce, Jessica N. Hampton, and Christopher Byers
Industrialized nations throughout the world, with the notable exception of the United States, provide their citizens with some form of national health care and national health insurance (Russell, 2018). Although their healthcare systems differ in several respects, their governments pay all or most of the costs for health care, drugs, and other health needs. In Denmark, for example, the government provides free medical care and hospitalization for the entire population and pays for some medications and some dental care. In France, the government pays for some of the medical, hospitalization, and medication costs for most people and all these expenses for people who are low-income, unemployed, or have children under the age of ten. In Great Britain, the National Health Service pays most medical costs for the population, including medical care, hospitalization, prescriptions, dental care, and eyeglasses. In Canada, the National Health Insurance system also pays for most medical costs. Patients do not even receive bills from their physicians, who instead are paid by the government. Medical debt and bankruptcy due to accidents or disease is a uniquely American problem.
These national health insurance programs are commonly credited with reducing infant mortality, extending life expectancy, and, more generally, for enabling their citizens to have relatively good health. Notably, the United States ranks 33 out of 36 countries who belong to the Organisation for Economic Cooperation and Development (OECD) for infant mortality. The infant mortality rate in the United States is 5.9 deaths per 1,000 live infant births, as compared to the average rate of 3.9 deaths per 1000 births. Five countries have death rates lower than 2 per 1,000 births. Their populations are generally healthier than Americans, even though healthcare spending is much higher per capita in the United States than in these other nations. In all these respects, these national health insurance systems offer several advantages over the healthcare model found in the United States (Reid, 2010).
7.4.1 The Role of Health Insurance in the United States
Medicine in the United States is big business. Expenditures for health care, health research, and other health items and services have risen sharply in recent decades, having increased tenfold since 1980 as shown in Figure 7.11, and now cost the nation more than $2.6 trillion annually. This translates to the largest figure per capita in the industrial world. Despite this expenditure, the United States lags behind many other industrialized nations in several important health indicators.
US Health-Care Expenditure, 1980–2010 (in Billions of Dollars)
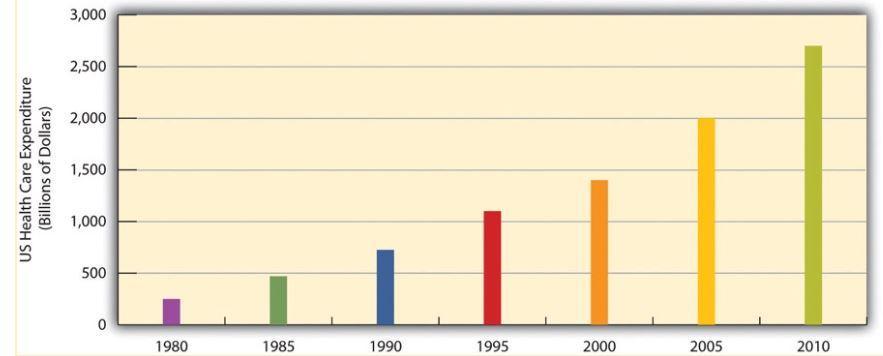
Figure 7.11. Expenditures for health care have increased tenfold since 1980.
7.4.2 Access to Health Care Coverage and Insurance
There are many insurance options in America, and we will see that they disproportionately benefit some and disadvantage others based on factors like sex, income, geographical location, and ethnicity. In 2017, some of the most common ways people accessed insurance included the following:
- Private plans
- Employer-based (56 percent)
- Direct purchase (16 percent)
Other methods of accessing insurance included government plans such as the following:
- Medicaid (19.3 percent)
- Medicare (17.2 percent)
- Military healthcare (4.8 percent) (U.S. Census Bureau, 2017).
To learn more about how people accessed health insurance coverage, and who remained uncovered, watch this seven-minute video provided by the United States Census Bureau (Figure 7.12).
Figure 7.12. 2017 Income, Poverty and Health Insurance – Health Insurance Presentation [YouTube Video]. This video presents a visual representation and map of health insurance coverage in the U.S.
The Affordable Care Act (ACA) was created to make healthcare more affordable and to be less discriminatory in 2010. In 2016, section 1557 provided new regulations to the Affordable Care Act, including a way to enforce civil rights protections in healthcare by making it unlawful for health care entities to discriminate against protected populations if they receive any type of federal financial assistance. This included health insurance companies participating in the Health Insurance Marketplaces, providers who accept Medicare, Medicaid, and Child Health Insurance Program (CHIP) payments, and any state or local healthcare agencies, among others. This marked the first time that discriminatory practices on the basis of race, skin color, national origin, age, sex, disability status–and in some cases, sexuality and gender identity–were broadly prohibited in the arena of public and private healthcare (Rosenbaum, 2016).
Some of the common ways that lower income families and individuals access insurance in Oregon are through programs like Medicaid and Children’s Health Insurance Programs (CHIP), which is referred to as Oregon Health plan (OHP) in Oregon, Figure 7.13.
| Family Size | OHP for Adults | OHP for Children |
| 1 | $1,396/month | $3,086/month |
| 2 | $1,893/month | $4,184/month |
| 3 | $2,390/month | $5,282/month |
| 4 | $2,887/month | $6,380/month |
| 5 | $3,383/month | $7,478/month |
| 6 | $3,880/month | $8,576/month |
Figure 7.13.Oregon Health Plan Income Limits for Application to Medicaid or OHP 2020 (Health Plans in Oregon, 2020).
Medicaid is a federal and state funded program that is managed by individual states. It provides government insurance to those who need it. Each state has the power to decide who is eligible for it, and most states focus on low-income individuals, and those with disabilities. With the expansion of the ACA in 2014, states had the choice to expand their Medicaid to serve more citizens; Oregon is one of 37 states that elected to do so. For up to date information on each state, consult this Kaiser Family Foundation interactive map and narrative.
The U.S. government’s website about Medicaid (https://www.medicaid.gov) provides state by state report cards on a wide variety of health access and health quality measures. This variance in Medicaid eligibility creates great inequity for low-income families based on location. Those in states that have not expanded Medicaid face a much larger “coverage gap,” meaning that many more families do not have access to health care insurance as shown in Figure 7.14 (Garfield et al., 2020).
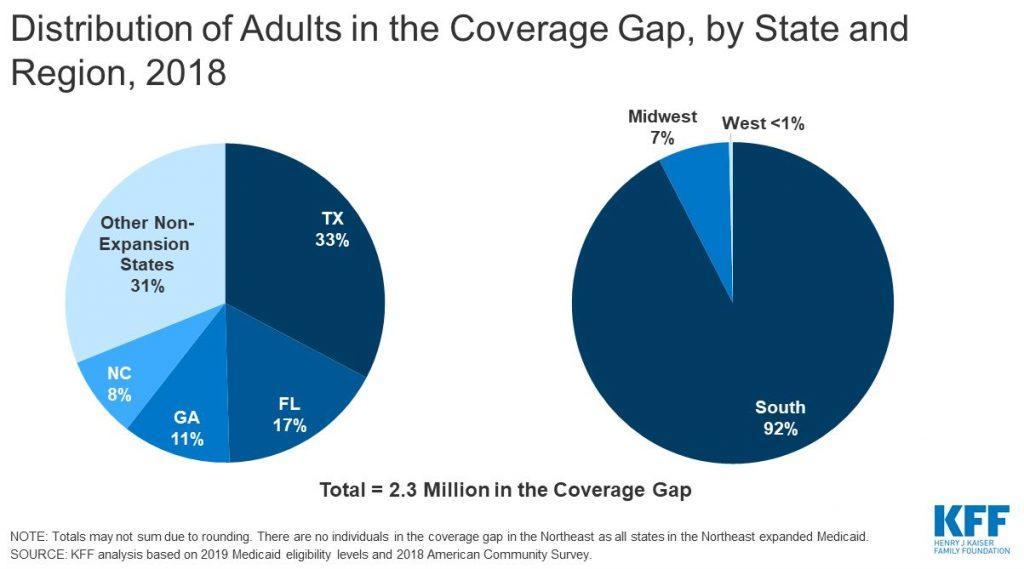
Figure 7.14. These graphs demonstrate that where you live affects your access to health care. Families who live in states that did not adopt the Medicaid expansion are more likely to have less access to health care.
Those who are age 65 or older can access healthcare insurance through Medicare, which is federally funded. Medicare covers about half of health care expenses for those enrolled, and many retirees who can afford to do so purchase private insurance or purchase additional coverage from Medicare itself to cover the gap (MedPac, 2020).
7.4.2.1 Focus On: Getting Tested for Coronavirus
Carmen Quinero, a 35-year-old essential worker who works at a distribution center that ships N95 masks in California, developed a severe cough in late March 2020. Her workplace’s human resources department told her to stay home until she was tested for the virus. Quinero has health insurance coverage through her employer; she has a $3,500 deductible.
Tests were not widely available in March 2020, so she was directed by her doctor to go to an emergency room. She went to the closest one, a for-profit hospital owned by Universal Health Services, one of the largest healthcare management companies in the United States. The Coronavirus Aid, Relief, and Economic Security Act (aka CARES Act) had passed the week before, and it had been widely publicized that coronavirus testing and treatment would be free to individuals and covered by the federal government.
Unfortunately, the legislation is full of loopholes, including for people like Quinero who need a test but were unable to get one due to the low supplies. Although she was given a chest x-ray and prescribed an inhaler, she was not tested. That means that not only was she responsible for the $1,840 in hospital and doctor fees, but she had to miss a week of work (mostly unpaid), putting a considerable financial strain on Quinero and her family.
Quinero’s case is not isolated and is not specific to the coronavirus. Access to, and coverage for, the test for COVID-19 illustrates how the patchwork of insurance, government programs and laws, and private payments inequitably affect lower-income people, whether or not they have health insurance coverage.
To hear more about Carmen’s story, listen to this 4-minute recording from the NPR-KFF series Bill of the Month.
7.4.3 Who Is Left Out?
“He who has health has hope; and he who has hope has everything.” Arabian Proverb
Most of the uninsured (84.6 percent) in the United States are working age adults aged 19 to 64 years old. Men are overrepresented in these numbers; over half of all people without health insurance coverage were male (54.6 percent), even though the U.S. population has more women than men. The uninsured are disproportionately concentrated in the South (U.S. Census Bureau, 2018). The number of people without health insurance has been increasing steadily since 2016; 8.5 percent of all Americans (27.5 million people) did not have health insurance at any point in the year of 2018, according to the American Community Survey (Berchick et al., 2020).
Socioeconomic status plays a large part in access to healthcare. Occupation, education level, and chronic poverty all play contributing roles. The unique structure of tying health care insurance to full-time employment in the United States perpetuates income equality. Income ties into important social determinants of health including location of home, transportation, and quality of life, as illustrated in Figure 7.15. Medicaid, which is tied to income level, has limited medical coverage, and often does not cover dental or vision care for adults. Plans vary from state to state. Children, older adults, and people of color are disproportionately affected by health inequities (Keenan & Vistnes, 2019).

Figure 7.15. During the coronavirus outbreak, many essential workers like nurses lacked personal protective equipment (PPE) like masks.
A separate study showed that before the expansion of the ACA in 2014, about 41 percent of Hispanic people, 26 percent of Black people, and 15 percent of White people were uninsured, while after expansion the rate of uninsured individuals decreased by 7 percent for Hispanic people, 5 percent for Black people, and 3 percent for White people (Buchmueller et al., 2016). Although the difference in rates for those uninsured have decreased, there is still a sizable gap that needs to be addressed in order to effectively address equity in access to health care (Inserro, 2018).
Even with these improvements, vast inequities exist state to state. A family may be eligible to receive Medicaid in one state but not in another state, especially those states that have not expanded Medicaid. Geography matters. Although our country has a rhetoric of equality, family and health laws vary significantly state to state, which reinforces inequalities. Eligibility ranges from having an income that is 40% of the Federal Poverty Line (FPL) to having an income that is 138% of the FPL: quite a difference!
Lack of health insurance has significant consequences because people are less likely to receive preventive health care and care for various conditions and illnesses. For example, because uninsured Americans are less likely than those with private insurance to receive cancer screenings, they are more likely to be diagnosed with more advanced cancer rather than an earlier stage of cancer (Halpern et al., 2008). In an analysis published in 2009, researchers found that there was a 25 percent higher risk of death for adults (aged 17–64) who were uninsured than those who had private insurance (Wilper et al., 2009).
7.4.3.1 Research and Drug Access
Pharmaceutical research and sales are a gargantuan business in the United States. The cost of developing any single new drug is estimated to be about one billion dollars as symbolized by Figure 7.16. Financing comes from the federal government and philanthropic organizations at the discovery research level; large sums of money are pumped into the initial stage of medication research (Institute of Medicine (U.S.) Forum on Drug Discovery, Development, and Translation, 2009).

Figure 7.16. Drug development is typically funded by the government and philanthropic organizations, but profits are funneled to corporations.
Later-stage development is typically funded by pharmaceutical companies, which can be for for-profit companies or nonprofit companies. For-profit companies may be funded by venture capitalists or as a part of larger corporations. Funding for nonprofit companies is a bit trickier; gaining access to federal and foundation funding takes staff time and expertise. The unequal and inequitable funding opportunities put nonprofits at a disadvantage, because they have to invest more time in writing requests for grants and funding from government corporations.
The cost of drugs in the United States increased dramatically starting in the 1990s. It is important to note that American families are not accessing more medications than people in comparative countries. In fact, Americans use fewer prescription drugs and are more likely to use less expensive generic prescriptions. It really comes down to price per pill; they simply cost more in the United States than in other countries as shown in Figure 7.17 (Haeder, 2019).
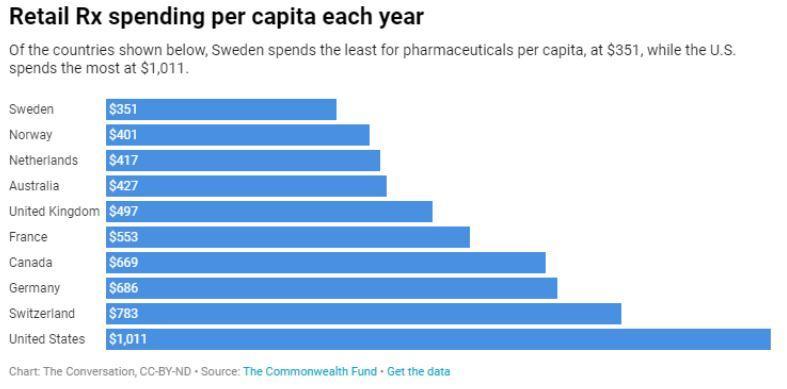
Figure 7.17. Pharmaceuticals cost more in the United States than in other countries.
For-profit pharmacological companies have the upper hand in terms of distribution and overall influence on the decisions for research and funding for new medications in the United States. Ethical dilemmas arise when a company has a mission of profit for its employees and public shareholders and is selling a product that has an impact on the consumers’ health. Making a profit may frequently be at odds with making medication or medical products accessible to those with limited resources. The drive for profit can also lead to overselling and overprescribing. It is for this reason that most countries (excluding the United States) do not allow drug research companies to profit and create state contracts with those companies in order to keep costs low (Gross, 1994).
7.4.3.2 In Focus: The Opioid Epidemic
An example of the power of for-profit drug companies can be found in the opioid epidemic. The opioid epidemic began in the United States in the 1940s. While medications like heroin and morphine have been used for pain management for thousands of years, they became more popular during World War II, when heroin and morphine were used to treat war veterans and people who have experienced trauma and wounds from battle.
Families in the United States with members who have difficulty navigating proper pain management have found opioids to be one solution. Prescriptions for these medications were given out and dispensed very generously, even for temporary pain, starting in the mid-20th century. As usage increased dramatically in the 1990s, pharmaceutical companies assured the medical community and patients that these drugs were not addictive (U.S. Department of Health and Human Services, 2019). It is now known that addiction to these opioids and other substances often starts with prescription medications and progresses to a more dangerous level of use if left unchecked (Figure 7.18).
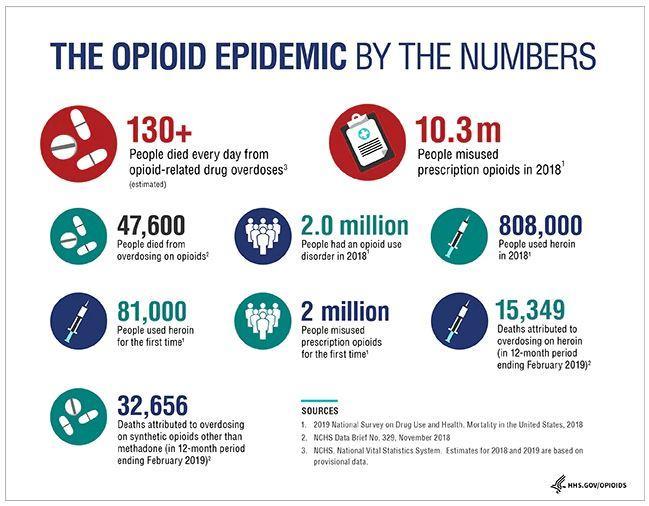
Figure 7.18. This 2019 chart illustrates the current opioid epidemic, which is estimated to kill over 130 people a day.
Private lawsuits and governmental action against pharmaceutical companies began to emerge in the early 2000s in the United States. It has been found that companies failed to follow government regulations related to drug production and regulation such as tracking and investigating suspicious orders of these medications. Both name-brand (e.g., Oxycodone) and generic drug manufacturers were guilty of these actions, although generic manufacturers remained unchecked for longer. Companies made billions of dollars of profits during this same period of time (Yerby, 2020).
Lawsuits against drug companies and distributors by the federal government, multiple states, Native American tribes, and local municipalities show promise for compensation. Examples include allegations of deceptive business practices, fraud, lax monitoring, and oversaturation of the market (Haffajee & Mello, 2017). These actions resulted in not only individual negative consequences but have also contributed to systemic breakdown in communities.
The ripple effects of opioid abuse on families and communities are difficult to quantify. While overdoses and deaths can be counted, loss and grief is immeasurable. Diminished parenting, loss of employment, loss of housing, and broken relationships all affect families, schools, workplaces, and communities. The effects of drug addiction and trauma are generational; we will not know how many families have been affected by this multi-century epidemic until well into the future.
7.4.4 Licenses and Attributions for Health and Health Insurance
7.4.4.1 Open Content, Original
“Health and Health Insurance” by Elizabeth B. Pearce, Jessica N. Hampton, and Christopher Byers
Figure 7.13 “Oregon Health Plan Income Limits 2020” by anonymous is licensed under CC BY 4.0.
Figure 7.15.”Where did THEY get masks?” by Katie Niemeyer is licensed under CC BY 4.0.
7.4.4.2 Open Content, Shared Previously
“Health Care and Health Insurance: A Comparison” is adapted from “Global Aspects of Health and Health Care” in Social Problems by Anonymous. License: CC BY-NC-SA 4.0. Adaptation: edited for clarity and accuracy.
Figure 7.11. “US Health-Care Expenditure, 1980–2010 (in Billions of Dollars)” in Social Problems by Anonymous. License: CC BY-NC-SA 4.0. Based on data from Statistical Abstracts/U.S. Census.
Figure 7.12 “2017 Income, Poverty and Health Insurance – Health Insurance Presentation” by the U.S.Census Bureau is in the public domain.
Figure 7.14. “Distribution of Adults in the Coverage Gap, by State and Region, 2018” by Peterson-KFF. License: CC BY-NC-ND 3.0.
Figure 7.16. “Money Behind Health Care” by Truthout. License: CC BY-NC-SA 2.0.
Figure 7.17. “Retail RX spending per capita each year” by The Conversation. License: CC BY-ND 4.0. Based on data from The Commonwealth Fund.
Figure 7.18. “The Opioid Epidemic by the Numbers” by the US Department of Health and Human Services. Public domain.