
10.5 Access to Water and Sanitation
Elizabeth B. Pearce and Alexis Castaneda-Perez
For about 100 years, water in the United States has been supported by a federally funded infrastructure that ensures families safe drinking water and sanitation. Water-borne diseases, such as cholera, were virtually eliminated by the provision of this system. Although the effort to create safe water and sanitation was well funded up until the end of the 20th century, there are some geographic areas and groups that are underserved; systems were not funded equitably before funding dried up.
Safe water and sanitation can be defined by these three things:
- access to safe and reliable drinking water
- a shower, toilet, and tap in the home
- a reliable system for treating and disposing of wastewater
Socioeconomic status is a barrier to safe water access. Challenges in poor communities include contaminated water supplies, housing with lead pipes, other substandard plumbing issues, and unequal distribution of public drinking water such as water fountains in schools and other public places.
As individuals more regularly carry their water with them, access to a bottle filling station can mean the difference between a one-time purchase or the ongoing expense of hundreds of plastic water bottles (Figure 10.14). Look around your own daily environments; where can you find these stations? Could there be more bottle fillers added and more equitably distributed?
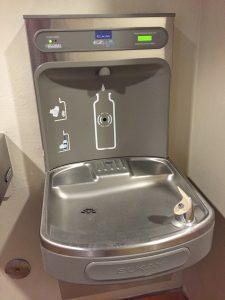
Figure 10.14. Water bottle filling stations cut down on costs related to disposable bottles.
10.5.1 Diverse Water Challenges
Almost one-third of adults in America are inadequately hydrated. Race is the biggest predictor to lack of water access; African American and Latinx people are more likely to experience lack of adequate hydration as are lower income people (Brooks et al., 2017). This graphic from the University of North Carolina describes six access challenges (Figure 10.15).
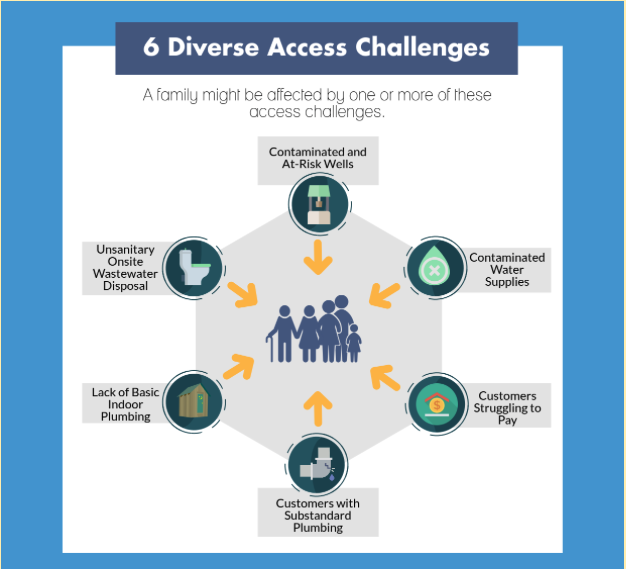
Figure 10.15. It is eye-opening to realize the number of water access challenges families face in the United States.
There is no centralized government or research entity that collects national data about water and sanitation in the United States, which creates challenges to assessing and meeting needs. In November 2019, the U.S. Water Alliance and Dig Deep, two organizations dedicated to improving water access for families in the United States, released a comprehensive report analyzing all available data from local, regional, and national sources. More than 2 million Americans lack access to safe water. Closing the Water Access Gap in the United States: A National Action Plan has five key findings:
- Federal data doesn’t accurately measure the water access gap.
- Race is the strongest predictor of water and sanitation access.
- Poverty is a key obstacle to water access.
- Water access challenges affect entire communities.
- Progress is uneven, and some communities are backsliding.
Along with race and poverty as indicators, the report identifies residents of Puerto Rico, houseless people, and members of Native American communities as having a greater likelihood of lack of access to water and sanitation (US Water Alliance, 2019).
10.5.2 In Focus: Flint, Michigan
Let’s look more closely at a community that has experienced a safe water crisis between 2014 and 2020. For some context, Flint, Michigan, was a booming city with an economy centered around the automotive industry through the late 20th century. In fact, this is where vehicle manufacturer General Motors was founded.
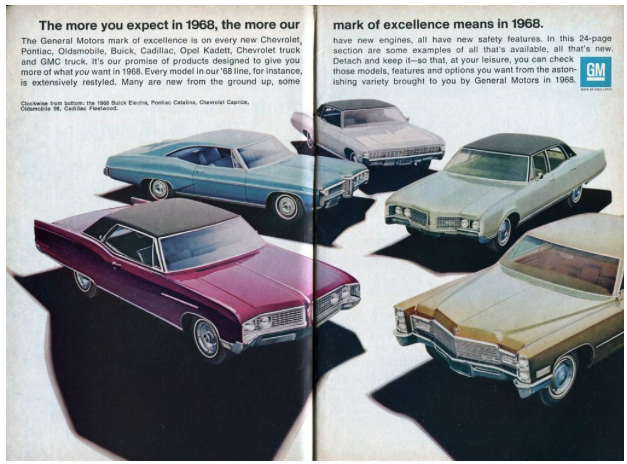
Figure 10.16. General Motors was a highly profitable automaker in the late 20th century.
However, like many United States cities, Flint suffered from the decline of the manufacturing industry, often referred to as deindustrialization. The decline was reinforced in the 1980s as the manufacturing industry hit a recession. The decline in the automotive industry hurt many people who relied on the industry, however the hurt was not uniformly felt across race and socioeconomic status. Many people who could afford to move relocated in search of better opportunities. People who could not afford to move were more or less forced to stay. Flint’s population shrunk from around 200,000 to just 100,000 residents (State of Michigan, 2016).
As the overall population of Flint declined, the African American population percentage of Michigan has steadily increased. According to Census data, in 1960 the total percentage of African Americans in Michigan was roughly 9 percent. By 2000, the total percentage of African Americans in Michigan was 14 percent (Metzger & Booza, 2002). The percentage of low income White Americans also increased. According to the U.S. census population estimates, 53.7 percent of Flint residents are African American and 40.4 percent of its population lives in poverty (Figure 10.17; U.S. Census Bureau, 2020). The median household income in Flint is about $24,000–$27,000 a year.
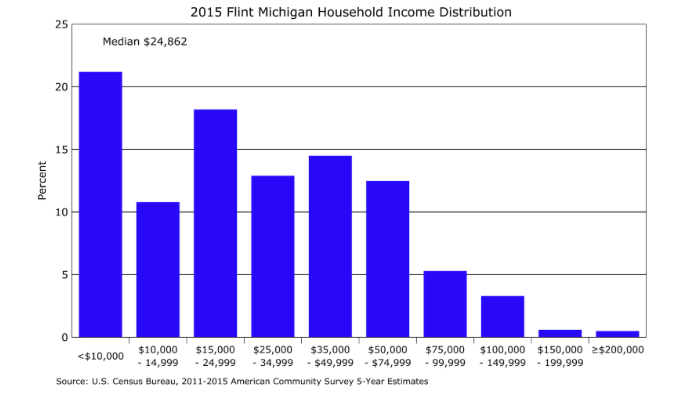
Figure 10.17. Flint, Michigan has many low-income families.
10.5.2.1 Saving Money
In 2014, Flint city officials decided to change its water source. The city used to get its water from the Detroit Water and Sewage Department. This water was treated and sourced from Lake Huron and the Detroit River. While this worked fine, the city was strapped for cash and, in 2011, Flint had a $25,000,000 deficit (City of Flint, 2012). The city declared a state of emergency and was looking for ways to save money. City leaders decided to source water from the Flint River as a cheap and temporary alternative while a pipeline from the Huron River was built. But the water was not treated properly for human consumption, which caused spikes of lead in the water. Immediately after the water source was switched, people noticed that the tap water in Flint was different. The color ranged from yellow to brown, smelled weird, and tasted terrible.
10.5.2.2 Effects on Families
In one home, Virginia Tech researchers found that the lead levels in the water were between 200 parts per billion (ppb) to 13,200 ppb (Mantha & Roy, 2015). Lead amounts above 5,000 pbb are classified by the EPA to be hazardous waste. Children are the most susceptible to the effects of lead. It can lead to many health issues such as anemia, slowed growth, and learning problems. Lead can put pregnant women at risk for miscarriage, as well as cause organ issues in adults. High levels of lead can cause death (Environmental Protection Agency, 2019). An outbreak of Legionnaires’ disease, a serious type of pneumonia (lung infection) caused by bacteria, is also thought to be caused by the water crisis (AlHajal, 2016). At least twelve people have died as a result, and numerous criminal and civil lawsuits have been filed against officials.
After 18 months of negotiations, the state of Michigan agreed to a $626 million settlement. More than 80 percent of that money would go to people who were minors and most affected by the toxins in the water.
10.5.2.3 Environmental Justice
According to the EPA, environmental justice is “the fair treatment and meaningful involvement of all people regardless of race, color, national origin, or income, with respect to the development, implementation, and enforcement of environmental laws, regulations, and policies” (Environmental Protection Agency, 2020). People of color and low-income families are disproportionately being affected by the water crisis in Flint, a classic case of environmental injustice. These families can’t easily move or fund a new source of water.
The EPA also emphasizes “the same degree of protection from environmental and health hazards” along with its definition of environmental justice. It is clear that the people of Flint are not receiving the same degree of protection. Watch this 3-minute video in Figure 10.18 to further understand the definition and history of environmental justice.
Figure 10.18. A Brief History of Environmental Justice [YouTube Video]. Environmental justice has been actively sought at least since the 1970’s.
10.5.2.4 Deindustrialization in Rural America
The decline of deindustrialization can be felt in rural communities as well. For example, Oregon’s timber industry faced a massive decline after the 1980s recession (Mapes, 2019). Environmental regulations have affected job availability. We can see many parallels between this situation and other communities who have faced job and company losses. Many towns that were dependent on the income from the timber industry are now left struggling.
Douglas county recently voted to shut down their entire library system (Figure 10.19; Friedman, 2019). Jackson County and Josephine County have also had to shut down their libraries, although eventually they managed to bring back partial services (Swinder, 2017). Many timber towns depended on a federal program that gave $100,000,000 every year to Oregon counties. Since the program has been discontinued, many counties are having to make sacrifices to keep from going under (Mapes, 2014). Another parallel we can see between the deindustrialization of Michigan and Oregon is people leaving small towns for urban centers, with those remaining mostly being of low income.

Figure 10.19. When cities and counties are underfunded, they must choose between programs that serve all families such as water, parks, schools, and libraries.
Lawmakers in these communities face similar choices as the leaders in Flint, Michigan. When there are fewer taxpayers to fund local services and less federal funding for services that all families can use, programs such as libraries, schools, parks, and even water must be examined as places to save money. As in Flint, the lack of services disproportionately hurts people with low income who are unable to or reluctant to move to other communities.
10.5.3 Licenses and Attributions for Access to Water and Sanitation
10.5.3.1 Open Content, Original
“Access to Water and Sanitation” by Elizabeth B. Pearce and Alexis Castaneda-Perez is licensed under CC BY 4.0.
10.5.3.2 Open Content, Shared Previously
Figure 10.14. “Water Bottle Fountain, Brokeoff Mountain 2015” by ray_explores. License: CC BY 2.0.
Figure 10.16. “1968 General Motors Buick Electra Pontiac Catalina Caprice Olds 98 Fleetwood Advertisement Readers Digest November 1967” by SenseiAlan. License: CC BY 2.0.
Figure 10.17. “Distribution of household income in Flint, Michigan in 2015” by Delphi234. CC0. Data from US Census in 2015 inflation adjusted dollars.
Figure 10.18. “A Brief History of Environmental Justice” by ProPublica. License Terms: CC BY 4.0.
Figure 10.19. “Library” by Albuquerque South Broadway Cultural Center. License: CC BY 2.0.
10.5.3.3 All Rights Reserved Content
Figure 10.15. “An Overview of Clean Water Access Challenges in the United States” (c) University of North Carolina Environmental Finance Center. Used under fair use.
10.5.4 References
Brooks, C. J., Gortmaker, S. L., Long, M. W., Cradock, A. L., & Kenney, E. L. (2017). Racial/ethnic and socioeconomic disparities in hydration status among us adults and the role of tap water and other beverage intake. American Journal of Public Health, 107(9), 1387–1394. https://doi.org/10.2105/AJPH.2017.303923
US Water Alliance. Dig Deep. (2019, November). Closing the water access gap in the United States. http://uswateralliance.org/sites/uswateralliance.org/files/Closing%20the%20Water%20Access%20Gap%20in%20the%20United%20States_DIGITAL.pdf
U.S. Census Bureau. (2020). QuickFacts: Flint City, Michigan [table]. Retrieved February 17, 2020 from https://www.census.gov/quickfacts/flintcitymichigan
City of Flint. (2012, April 15). Quarterly report to the state Treasurer regarding the financial condition of the City of Flint. https://www.cityofflint.com/wp-content/uploads/Reports/Quarterly%20Report%20to%20State%20Treasurer%20April%2015,%202012.pdf
Mantha, A. & Roy, S. (2015, August 24). Hazardous waste-levels of lead found in a Flint household’s water. http://flintwaterstudy.org/2015/08/hazardous-waste-levels-of-lead-found-in-a-flint-households-water/
Environmental Protection Agency. (2019, August 12). Learn about lead. https://www.epa.gov/lead/learn-about-lead
AlHajal, K. (2016, January 13). 7 cases, 10 fatal, of Legionella bacteria found in Flint area; connection to water crisis unclear. MLive. https://www.mlive.com/news/detroit/2016/01/legionaires_disease_spike_disc.html
Environmental Protection Agency. (2020, February 17). Environmental justice. https://www.epa.gov/environmentaljustice
State of Michigan Department of Technology, Management, and Budget. (2016, April). Demographic and labor market profile: City of Flint. http://milmi.org/Portals/198/publications/Flint_City_Demographic_and_Labor_Mkt_Profile.pdf
Metzger, K. & Booza, J. (2002, February). African Americans in the United States, Michigan and Metropolitan Detroit. Wayne State University. Center for Urban Studies. http://www.cus.wayne.edu/media/1356/aawork8.pdf
Mapes, J. (2019, January 10). Charting the decline of Oregon’s timber industry. Oregon Live. https://www.oregonlive.com/mapes/2012/01/charting_the_decline_of_oregon.html
Friedman, G. R. (2019, January 9). Douglas County libraries to close after voters reject funding (Figure 10.16). https://www.oregonlive.com/politics/2017/03/douglas_county_libraries_to_cl.html.
Swinder, S. (2017, April 5). When libraries close, timber counties face tough reality.https://www.oregonlive.com/pacific-northwest-news/2017/04/when_libraries_close_timber_co.html
Mapes, J. (2014, December 10). Federal payments to timber counties die in last-minute congressional maneuvering. Oregon Live. https://www.oregonlive.com/mapes/2014/12/federal_payments_to_timber_cou.html