
6.3 Decision-Making and Power
Much of the decision-making in the United States is executed by elected officials via legislation that passes through several branches of government. While most are elected by popular vote, the President is elected through the electoral college and some leaders, including the President, have the authority to appoint other decision-making officials such as judges and cabinet secretaries. People who have the right to vote, and who choose to vote, have some influence on who gets elected. Voting is important and is one aspect of representation, a potential equalizer in a country in which some decisions are made via direct democracy (each individual has a vote) and others are made by representative democracy (elected representatives).
As we will explore in this section, however, there are complicating factors that affect elections and equity.
6.3.1 Who Votes?
There are a variety of reasons that people don’t vote in local, state, and national elections. Thomas Jefferson is known for saying, “We do not have government by the majority. We have government by the majority who participate.” Ironically, Jefferson was a part of the legislature that limited which people in the United States actually had the right to vote. In fact, what he could have said was, “We do not have government by the majority. We have government by the majority of people whom we have allowed to vote and who participate.” This text aims to examine how institutions still limit voting rights both explicitly and implicitly.
6.3.1.1 Older, More Educated and Non-Hispanic
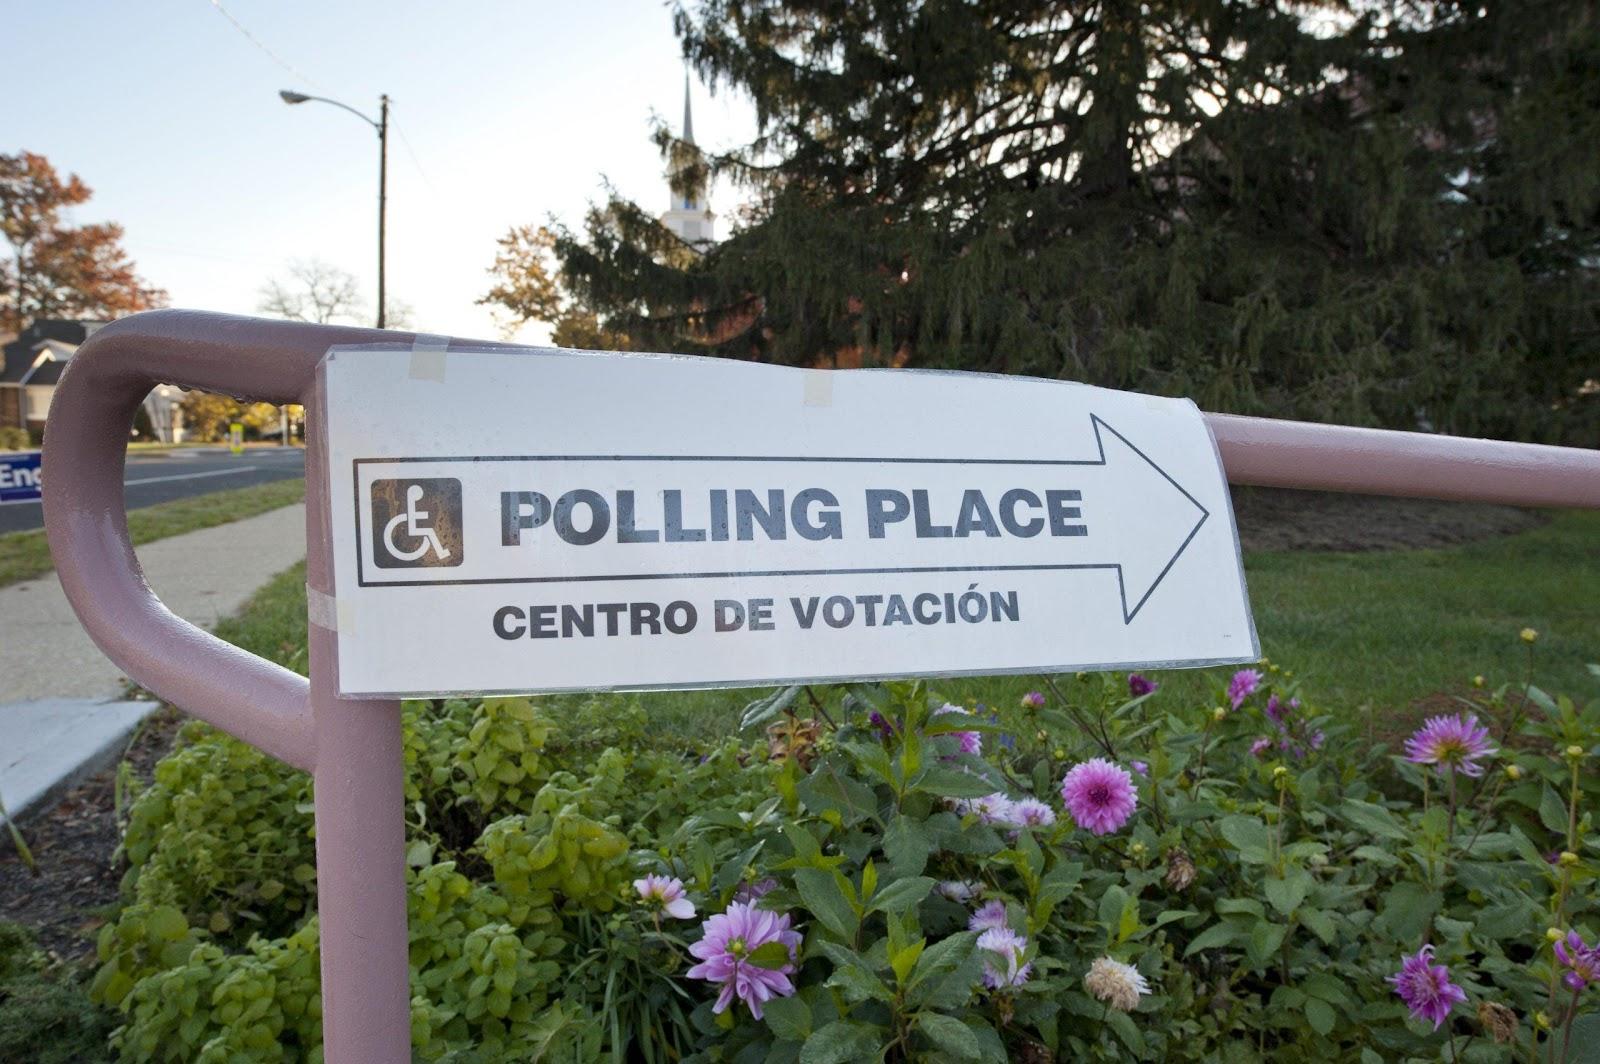
Figure 6.7. People who are older, non-Hispanic, and more educated are more likely to vote.
In general, voter turnout in the United States is higher during presidential elections, which occur every four years. In measurements between 1984 through 2016, people who are older, non-Hispanic, and more educated are most likely to vote. Those who are 60+ years old vote the most, followed by those aged 45–59 years, then by those aged 30–44 years, and with 18- to 29-year-olds having the lowest likelihood of voting with more than double 60+ year-old voting (65%) compared with 31 percent of 18- to 29-year-olds voting in the 2018 election (Figure 6.9).
It could be argued that the youngest citizens have the most at stake and could have the greatest impact on the future of the United States and yet they are voting less. Younger, less educated, Latinx people are less likely to vote? In your viewpoint, what is behind the numbers that people in these demographics are voting less?
6.3.2 Voter Registration Across the United States
Elections are state-by-state contests. They include general elections for president and statewide offices (e.g., governor and U.S. senator), and they are often organized and paid for by the states. Because political cultures vary from state to state, the process of voter registration also varies. For example, suppose an 85-year-old retiree with an expired driver’s license wants to register to vote. The retiree might be able to register quickly in California or Florida, but a current government ID might be required prior to registration in Texas or Indiana.
The varied registration and voting laws across the United States have long caused controversy. In the aftermath of the Civil War, southern states enacted literacy tests, grandfather clauses, and other requirements intended to disenfranchise Black voters in Alabama, Georgia, and Mississippi. Literacy tests were long and detailed exams on local and national politics, history, and more. They were often administered arbitrarily with more Black voters required to take them than White voters (Medvic, 2014). Consider these literacy tests along with the practice of refusing schooling to Black children and you will understand how these requirements became part of a racist system that prevented Black people from voting. Poll taxes required voters to pay a fee to vote. Grandfather clauses exempted individuals from taking literacy tests or paying poll taxes if they or their fathers or grandfathers had been permitted to vote prior to a certain point in time. While the Supreme Court determined that grandfather clauses were unconstitutional in 1915, states continued to use poll taxes and literacy tests to deter potential voters from registering (Guinn v. United States, 1915). States also ignored instances of violence and intimidation against African Americans wanting to register or vote (Medvic, 2014).
The ratification of the Twenty-Fourth Amendment in 1964 ended poll taxes, but the passage of the Voting Rights Act (VRA) in 1965 (Figure 6.5) had a more profound effect. The act protected the rights of minority voters by prohibiting state laws that denied voting rights based on race. The VRA gave the U.S. attorney general authority to order federal examiners to areas with a history of discrimination. These examiners had the power to oversee and monitor voter registration and elections. States found to violate provisions of the VRA were required to get any changes in their election laws approved by the U.S. attorney general or by going through the court system.
However, in Shelby County v. Holder (2013), the Supreme Court, in a 5–4 decision, threw out the standards and process of the VRA, effectively gutting the landmark legislation. This decision effectively pushed decision-making and discretion for election policy in VRA states to the state and local levels. Several such states subsequently made changes to their voter ID laws and North Carolina changed its plans for how many polling places were available in certain areas. Texas also restricted voting based on photo identification; these changes often do not have a neutral effect. In fact, when the U.S. Court of Appeals struck down one North Carolina law in 2016, they found that it targeted “African Americans with almost surgical precision.”
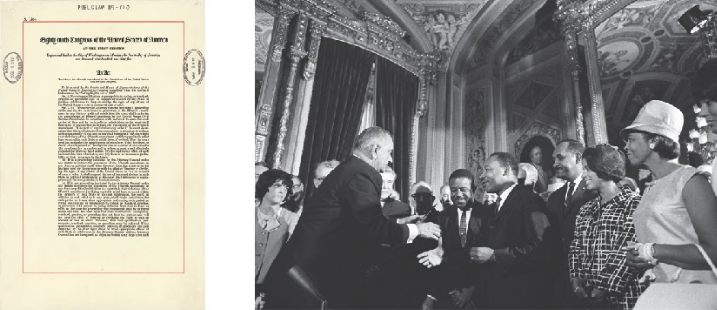
Figure 6.8. The Voting Rights Act (a) was signed into law by President Lyndon B. Johnson (b, left) on August 6, 1965, in the presence of major figures of the civil rights movement, including Rosa Parks and Martin Luther King Jr. (b, center).
The effects of the VRA were visible almost immediately. In Mississippi, only 6.7 percent of Black people were registered to vote in 1965; however, by the fall of 1967, nearly 60 percent were registered. Alabama experienced similar effects, with African American registration increasing from 19.3 percent to 51.6 percent. Voter turnout across these two states similarly increased. Mississippi went from 33.9 percent turnout to 53.2 percent, while Alabama increased from 35.9 percent to 52.7 percent between the 1964 and 1968 presidential elections (Grofman et al., 1992).
Following the implementation of the VRA, many states have sought other methods of increasing voter registration. Several states make registering to vote relatively easy for citizens who have government documentation. Oregon has few requirements for registering and registers many of its voters automatically. North Dakota has no registration at all. In 2002, Arizona was the first state to offer online voter registration, which allowed citizens with a driver’s license to register to vote without any paper application or signature. The system matches the information on the application to information stored at the Department of Motor Vehicles, to ensure each citizen is registering to vote in the right precinct. Citizens without a driver’s license still need to file a paper application. More than eighteen states have moved to online registration or passed laws to begin doing so. The National Conference of State Legislatures estimates, however, that adopting an online voter registration system can initially cost a state between $250,000 and $750,000 (National Conference of State Legislatures, 2014).
Other states have decided against online registration due to concerns about voter fraud and security. Legislators also argue that online registration makes it difficult to ensure that only citizens are registering and that they are registering in the correct precincts. As technology continues to update other areas of state recordkeeping, online registration may become easier and safer. In some areas, citizens have pressured the states and pushed the process along. A bill to move registration online in Florida stalled for over a year in the legislature, based on security concerns. With strong citizen support, however, it was passed and signed in 2015, despite the governor’s lingering concerns. In other states, such as Texas, some are concerned about identity fraud, so traditional paper registration has been preferred until the COVID-19 pandemic, which has renewed interest in voting methods other than in-person.
6.3.3 Voting by Mail
Oregon was the first state to enact postal voting, or “vote-by-mail” in the United States, in 1998. Voter turnout dramatically increased with this adaptation, and Oregon continues to have one of the highest participation rates in the country. Of course, absentee and early voting have long been available for military families and for individuals by request. As of 2020, Colorado, Hawaii, Washington, and Utah have all converted to vote-by-mail elections. The coronavirus pandemic has raised concerns about people visiting crowded polling places, and 46 states are loosening restrictions on vote-by-mail. To view the voting status of individual states, check out ballotpedia; to investigate overall voting information, consult this usa.gov website.
Research repeatedly shows that allowing people to vote by mail increases participation. A draft working paper of a Stanford University study found that postal voting in Colorado increased voter participation by 10 percent. Notably, turnout among groups less likely to vote increased even more: 16 percentage points among young people, 13 percent among African Americans, 11 percent among Asian Americans, and 10 percentage points among Latinx Americans, blue-collar workers, those without a high school diploma, and those with less than $10,000 of wealth (Bonica et al., 2020).
Republican lawmakers are divided on the issue of voting by mail, while Democratic lawmakers generally support this effort. Experts, including researchers and political science professors, do not believe that voting by mail is likely to increase fraud. Voting continues to be a state responsibility, which means it varies a great deal. In the November 2020 election, that variance became a point of legal and social debate. Not only did states already have differing processes, but the legislators’ efforts to ensure that as many people as possible could vote given the social distancing required by the pandemic, created greater discrepancies and differences in voting rules. While then-President Trump and many other individuals questioned the validity of these processes in four states that had close presidential vote counts, the courts and the officials of those states consistently verified the results.
6.3.4 Barriers to Voting
Although the right to vote is more equitably distributed than in the past, institutional and societal factors still influence who actually votes. If there were times that you didn’t vote, what got in the way? A busy life might keep you from voting. In the following sections, we’ll explore some of the most common barriers to voting.
6.3.4.1 Socioeconomic Status
When voting is limited to one day (e.g., 12 hours in November), people who have more restrictive work, school, parenting, childcare, or other schedules will have more challenges in getting to the polling location during the limited time. Workers in jobs with less autonomy (e.g., retail, clerical, and blue-collar workers) have less flexibility on voting day than those in managerial or professional positions. Transportation can be a factor; personal vehicles provide the most efficiency in a busy life. Using shared vehicles, public transportation, bicycles, and walking (while more cost and energy effective) all take longer.
If you are a working parent faced with choosing between getting food on the table for your two young children or transporting them and waiting in line to vote in the election, which do you choose? If you need to race home from work so that your partner can use your shared vehicle to get to their evening shift, do you then go take a bus to vote?
Families with a lower socioeconomic status are more likely to have a combination of these factors that contribute to having less flexibility and less time (Figure 6.8). Families who have more resources in general have more resources related to political activity and are more likely to participate in voting in person. Those who are unemployed are the least likely to vote.
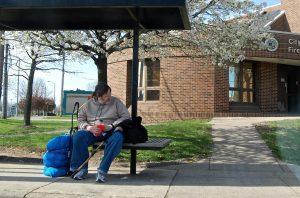
Figure 6.9. Families with a lower socioeconomic status face more barriers getting to polling stations.
6.3.4.2 Disabilities
People with disabilities vote at a 6 percent lower rate than people who do not have disabilities and share other demographic characteristics, as measured by Rutgers University in the 2016 election (Schur & Kruse, 2017). Why might that be? One factor may be the polling places themselves. The U.S. Government Accountability Office (GAO) observed 178 polling places during that same election. They found that 60 percent of the polling places had some kind of physical impediment between the parking lot and the entry to the buildings (Figure 6.7). Of the 137 that could be observed inside, 65 percent had polling stations that could impede someone from casting their votes independently as shown in Figure 6.10 (U.S. Government Accountability Office 2017).
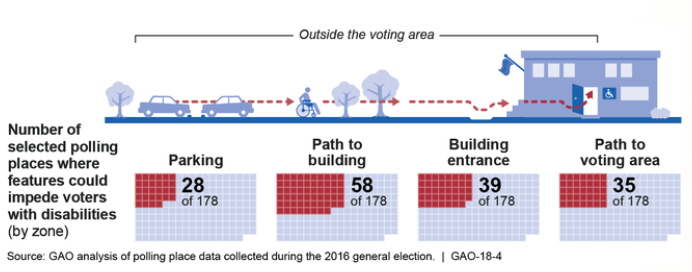
Figure 6.10. Voters with disabilities often face physical barriers to voting, including inaccessible parking, paths, and entrances.
There are efforts underway to improve access to and participation in voting among people with disabilities. The American Association of People with Disabilities (AAPD) is working in selected states to increase voter registration and turnout. REVUP (Register, Educate, Vote, Use your Power) has shown a 1 percent increase in the voting participation of people with disabilities in REVUP states compared with non-REVUP states between 2014 and 2018 (Schur & Kruse, 2019). This is a small increase in a very large sample, and it is difficult to say if REVUP is the main factor.
6.3.4.3 Felony Convictions
The majority of states in the United States limit people who have been convicted of felonies from voting, at least during the time that they are incarcerated. (The exceptions are Maine and Vermont.) Variances among states include whether rights are lost just while incarcerated, while still serving parole and/or probation or whether rights are restored automatically after release (Figure 6.8). Oregon is one of 16 states plus the District of Columbia that automatically restore rights (National Council of State Legislatures, 2019).
There are 11 states that have additional restrictions including the payment of fees, fines, and restitution before voting rights are restored. These kinds of restrictions treat families unevenly; individuals who have lower income and no accumulated wealth will be less likely to be able to access their voting rights than will people with wealth and means.
Generally, the trend over the last few decades by states is to restore voting rights to felons once they are released. There are variations state by state as these movements go forward. What is your viewpoint about the right to vote and how it overlaps with people who have committed crimes? Do you think that people serving time should be able to vote? What about those who have rehabilitated and/or paid a debt to society? What about those same people whether they are poor or rich? Should socioeconomic status affect the right to vote?
6.3.4.4 Residency and Citizenship Status
Citizenship status also can pose a barrier to voting. According to USA.gov, non-citizens, including permanent legal residents, cannot vote in federal, state, and most local elections (usagov. n.d.).
There are 14 U.S. territories, all of which are in the Pacific or Caribbean Oceans. Thirteen of these territories, including Puerto Rico, are unincorporated which means that only select parts of the Constitution apply to them. For example, they do not have representation in the U.S. Congress or Senate, do not pay federal income tax, and cannot vote for the President of the United States. Residents of Puerto Rico voted in favor of full statehood in the 2020 elections via a non-binding referendum (WorldAtlas, 2020.) Many people believe that the citizens of Puerto Rico and other territories would benefit from statehood and representation at the federal level.
6.3.4.5 Feeling Disenfranchised
There are times when people feel so disconnected from the process of democracy and representation that voting seems hopeless. If elected officials repeatedly fail to discuss issues of importance to a person or their family, or if the decision outcomes are consistently inadequate, people may develop apathy toward the voting process. Growing up in a family where the parent(s) don’t vote or who express cynicism or distrust toward representatives and the voting process also impacts children’s views of the system and participation. As discussed at length in this chapter, there has been a great deal of effort made to limit people of color, the poor, and immigrants from voting in at least some states. It’s hard to think that you belong and that your vote matters when institutions work against your voting rights, as expressed in the following quote.
“Voting is not an act of political freedom. It is an act of political conformity. Those who refuse to vote are not expressing silence. They are screaming in the politician’s ear: ‘You do not represent me. This is not a process in which my voice matters. I do not believe you’.” – Wendy McElroy, a Canadian individualist feminist and anarcho-capitalist writer
In some states, one political party (Democratic or Republican) has such a majority position that if you are a member of the other dominant party or of an alternative party, it may not seem “worth it” to vote. They may feel that their vote doesn’t make a difference or that the election is not a competitive one.
6.3.5 Barriers to Participation
Does your city have an elected council? How about your school board? Are judges elected or appointed in your area? Is there a County Board of Commissioners? Take a minute to think about what you know about how someone gets one of these positions. Are they paid at all? If so, do they pay enough to support an individual or family? Many of them are elected positions, although they are not paid. For example, in Corvallis, Oregon neither the school board nor the City Council are paid positions. The Benton County Commissioner positions (of which Corvallis is a part) are paid; three Commissioners each make between $84,000 and $94,100 in 2019 (Hall, 2019). Typically, salaries of public employees are public information and you can find it via an internet search on the entity’s website or in a newspaper report on salary negotiations.
We ask these questions for several reasons. First, those decision-makers affect all of our lives. If you question whether or not a school board member affects your daily life, consider those board members who decided how and if school will be held during the COVID-19 pandemic. Consider the recent national and local debates about what kinds of bathrooms and locker rooms students can access, and who determines which students will use which bathrooms.
Many of these local positions are unpaid. If they are not paid, but require many hours of work each week, consider who is most likely to have the time available for such a position. Corvallis School Board Members are expected to devote time to reading policies, citizen input, budget documents, and related research as well as participating in trainings, committee discussions, and formal meetings. The time commitment varies from five to twenty hours per week and is unpredictable. This time commitment is similar for City Council members; remember that both positions are unpaid.
Given this context, it is likely that people who have a high enough income or accumulated wealth, a career that allows flexibility in work hours, or who are retired will be more likely to be able to afford the time and to dominate these boards. It is important to appreciate these public servants, their volunteer commitment, and their efforts to listen to all of their constituents. It is also important to acknowledge that these decision-makers are more likely to be older, have greater income and wealth, and have more education. How do you think this might influence the discussions the groups have and the decisions that they make? How would families benefit from a system that is more representative of the communities served? What systemic changes could be made to include voices that more fully represent the population?
6.3.6 Do Demographics Matter?
Ask yourself, how do social characteristics that make up social identity matter when it comes to who represents all families in the decision-making spaces of this country? This is a good time to remind yourself of the Social Identity Wheel introduced in Chapter 1 (Figure 6.11). When we talk about demographics, we are looking at the statistical data related to social identities.
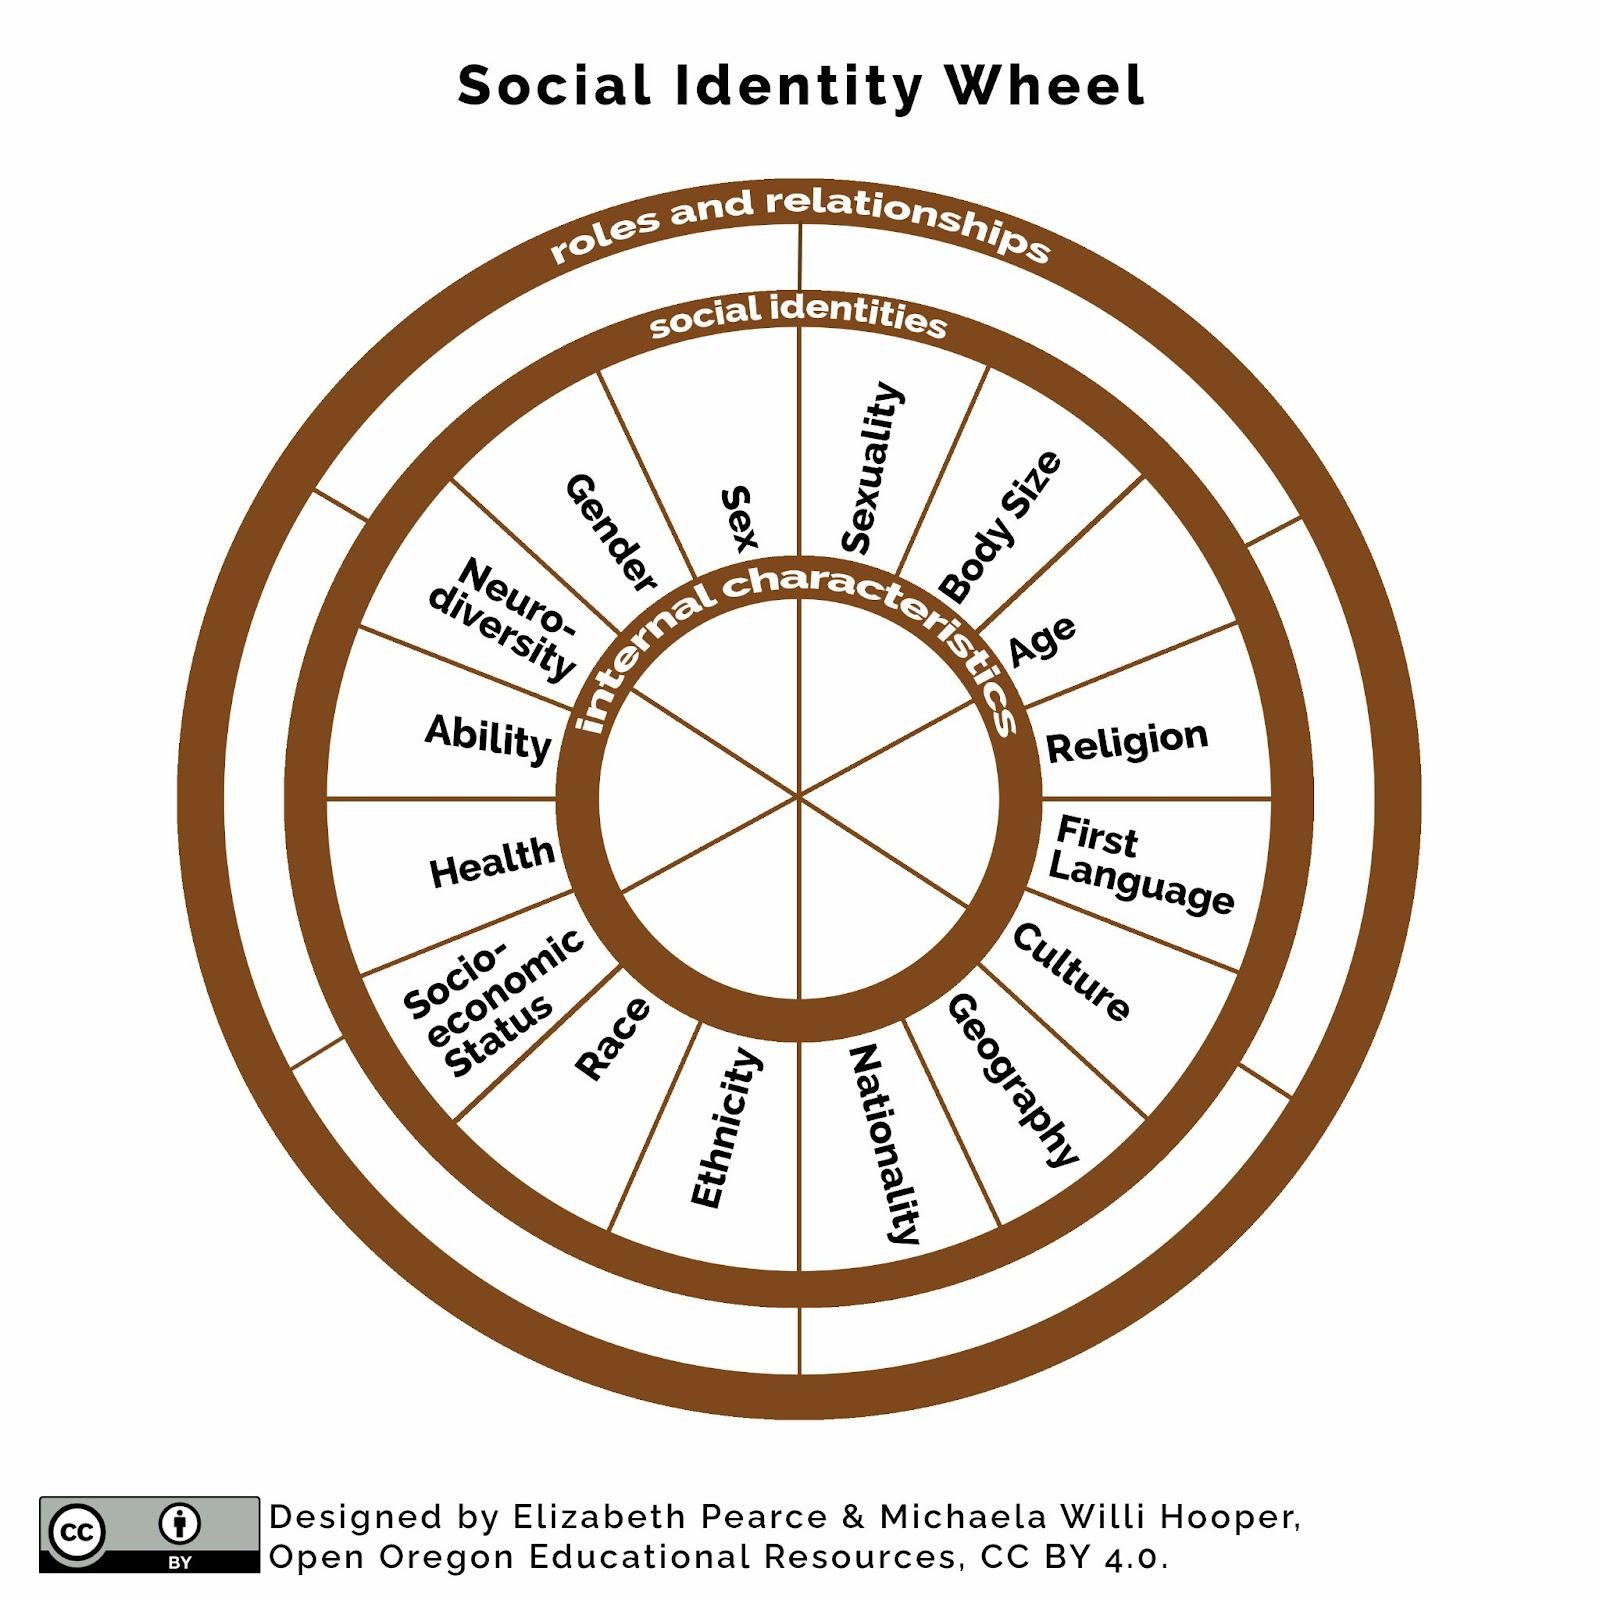
Figure 6.11. When we talk about demographics, we are looking at the statistical data related to social identities. Figure 6.11 Image Description
Let’s look at some of the demographics that are reported most frequently: race and gender. This very short (under two minutes) video from wholeads.us compares the demographics of the population in the United States with those of elected officials (Figure 6.12).
Figure 6.12. Who Leads Us? [YouTube Video]. The visuals in this video help us see whether our democracy is reflective of our demographics.
When the demographics are so skewed, we must ask ourselves whether those who are less represented via social identity are being treated equitably. Not just in the past, but right now.
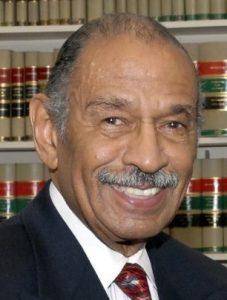
Figure 6.13. Representative John Conyers, Jr. (D-Michigan) introduced House Resolution 40, to study the effects of slavery, 28 times. It has still not been passed.
For example, in 1989, Representative John Conyers,Jr. (D-Michigan), pictured in Figure 6.13, introduced House Resolution (H.R.) 40 to the U.S. Congress for the first time (Figure 6.16). (The number “40” refers to the unfulfilled promise made that when slavery ended, every freed family would be allotted plots of land no larger than 40 acres, plus a mule. This proclamation was reversed by President Andrew Johnson after President Abraham Lincoln was assassinated.) Representative Conyers, who died in 2019, proposed H.R. 40 a total of 28 times, once per year from 1989 until 2017.
Which laws and policies would be moved forward, voted on, and passed if Black people had greater representation among elected officials? What if the system supported the employment of people of lower socioeconomic status in decision-making roles? How would this affect the inequality that families experience in the United States? Could you imagine how housing, health care, and employment might be different? These authors believe that more equitable representation, while not the only needed change, will lead to equitable access to education, health care, housing, food, and water. This will benefit all families, regardless of race, ethnicity, or gender. More equitable representation among decision-makers could lead to different systems and structures so that all families could meet their basic needs.
There is some progress toward more diverse representation in our elected officials. Pew Research reports that the racial and ethnic diversity of the U.S. Congress has grown gradually between 2001 and 2019. Currently, 116 members of the House of Representatives are people of color, which is an 84 percent increase over the 107th Congress of 2001 (Bialik, 2019). When it comes to gender parity, while the number of women who are participating in elected positions is increasing in the United States, it is increasing at a slower pace than in the rest of the world. While we ranked 48th in the world for elected gender parity in 2000 (out of 192 countries), 20 years later we have sunk to 82nd in the world as measured by Represent Women’s research (Figure 6.14). To use the interactive map below, learn more about their methodology, and see how individual states within the United States compare with one another, click here.
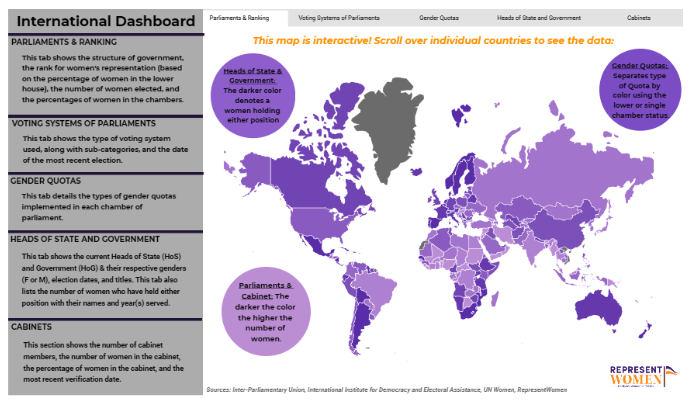
Figure 6.14. While the number of women who are participating in elected positions is increasing in the United States, the number is increasing at a slower rate than the rest of the world.
6.3.7 Licenses and Attributions for Decision-Making and Power
6.3.7.1 Open Content, Original
“Decision Making and Power” and all subsections except as noted below, by Elizabeth B. Pearce is licensed under CC BY 4.0.
Figure 6.11. “Social identity wheel” by Elizabeth Pearce and Michaela Willi Hooper. License: CC BY 4.0.
6.3.7.2 Open Content, Shared Previously
“Voter Registration Across the United States” is from “Voter Registration” in American Government 2e by Glen Krutz et al. License: CC BY 4.0. Adaptations: content moved around; updated for accuracy.
Figure 6.7. “Voting_02” by US Department of State.License: CC BY-NC 2.0.
Figure 6.8. “The first page of the Voting Rights Act of 1965.” Public domain. “President Lyndon B. Johnson meets with Martin Luther King, Jr. at the signing of the Voting Rights Act of 1965” by Yoichi Robert Okamoto. Public domain.
.jpg)
Figure 6.9. “waiting” by vistavision. License: CC BY-NC-ND 2.0
Figure 6.10. “Number of selected polling places where features could impede voters with disabilities (by zone)” by Government Accountability Office. Public domain.
Figure 6.13. “United States Representative John Conyers (D-MI) official photo” by US Congress. Public domain.
.jpg)
Figure 6.14. “International Women’s Representation Dashboard” by Represent Women. License: Permission to share with credit at bottom of homepage.
6.3.7.3 All Rights Reserved Content
Figure 6.12. “Who Leads Us?” (c) Women’s Donor Network. License Terms: Standard YouTube license.
6.3.8 References
What are the US territories? (2020, November 30). WorldAtlas. https://www.worldatlas.com/articles/the-territories-of-the-united-states.html
Medvic, S. (2014). Campaigns and elections: Players and processes (2nd ed). Routledge.
Guinn v. United States, 238 U.S. 347 (1915).
Medvic, S. (2014). Campaigns and elections: Players and processes (2nd ed). Routledge.
Shelby County v. Holder, 570 U.S. ___ (2013).
Grofman, B., Handley, L., ^ Niemi, R. G. (1992). Minority representation and the quest for voting equality. Cambridge University Press, p. 25.
National Conference of State Legislatures. (2014, April). Online voter registration grows in 2014. The Canvass, 48. https://www.ncsl.org/research/elections-and-campaigns/states-and-election-reform-the-canvass-april-2014.aspx
Bonica, A., Grumbach, J. M., Hill, C., & Jefferson, H. (2020, May 4). All-mail voting in Colorado increases turnout and reduces turnout inequality [draft working paper]. Retrieved September 12, 2020, from http://voteathome.wpengine.com/wp-content/uploads/2020/07/CO-VAH-research-Hill-et-al.pdf
Schur, L. & Kruse, D. (2017, July). Fact sheet: Disability and voter turnout in the 2016 elections. Rutgers School of Management and Labor Relations. Program for Disability Research Publications. https://smlr.rutgers.edu/sites/default/files/documents/PressReleases/kruse_and_schur_-_2016_disability_turnout.pdf
U.S. Government Accountability Office. (2017, November 2). Voters with disabilities: Observations on polling place accessibility and related federal guidance. https://www.gao.gov/products/GAO-18-4
Schur, L. & Kruse, D. (July 2019). Fact sheet: Estimating the effect of the REVUP campaign on disability turnout. https://smlr.rutgers.edu/sites/default/files/revup_factsheet.pdf
National Council of State Legislatures. (2019, October 14). Felon voting rights. Retrieved July 17, 2020, from https://www.ncsl.org/research/elections-and-campaigns/felon-voting-rights.aspx
Hall, B. (2019, August 5). No pay hike for commissioners. Corvallis Gazette-Times. https://www.gazettetimes.com/news/local/no-pay-hike-for-commissioners/article_23d1e7ea-23ce-50b2-9a06-86d17774f68b.amp.html
Montanaro, D., Wellford, R., & Pathe, S. (2014, November 11). Money is pretty good predictor of who will win elections. PBS. https://www.pbs.org/newshour/politics/money-pretty-good-predictor-will-win-elections
Alexander, D. (2019, August 14). The net worth of every 2020 presidential candidate. Forbes. https://www.forbes.com/sites/danalexander/2019/08/14/heres-the-net-worth-of-every-2020-presidential-candidate/
Evers-Hillstrom, K. (2020, April 23). Majority of lawmakers in 116th Congress are millionaires. https://www.opensecrets.org/news/2020/04/majority-of-lawmakers-millionaires/
Bialik, K. (2019, February 8). For the fifth time in a row, the new Congress is the most racially and ethnically diverse ever. Pew Research Center. https://www.pewresearch.org/fact-tank/2019/02/08/for-the-fifth-time-in-a-row-the-new-congress-is-the-most-racially-and-ethnically-diverse-ever/
Who can and can’t vote in U. S. Elections | usagov. (n.d.). Retrieved February 17, 2023, from https://www.usa.gov/who-can-vote
Image Description for Figure 6.11:
Visualization of Social Identity Wheel
A wheel with three rings divided into sections of attributes. The inner and outer are blank segments.
Middle ring
These are social identities. Attributes include:
- Nationality
- First Language
- Religion
- Ability
- Neurodiversity
- Health
- Body size
- Age
- Sex
- Gender
- Sexuality
- Race
- Culture
- Ethnicity
- Socioeconomic Status (SES)
- Geography