
3.7 Union Dissolution and Divorce
The U.S. divorce rate has risen since the early 1900s, with several peaks and valleys, and is now one of the highest in the industrial world. It rose sharply during the Great Depression and World War II, probably because of the economic distress of the former and the family disruption caused by the latter, and fell sharply after the war as the economy thrived and as marriage and family were proclaimed as patriotic ideals. It dropped a bit more during the 1950s before rising sharply in the 1970s (Cherlin, 2009). The divorce rate has declined steadily since 1980 as shown in Figure 3.19.
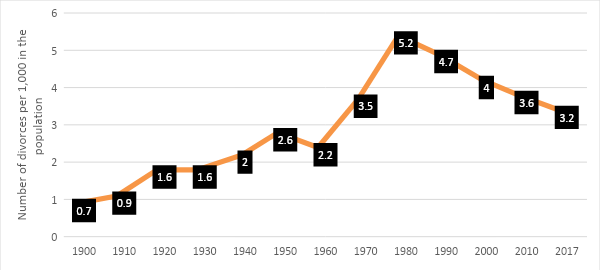
Figure 3.19 Number of Divorces per 1,000 in the population, 1900-2017
3.7.1 Reasons for Divorce
We cannot be certain about why the divorce rate rose so much during the 1960s and 1970s, but we can rule out two oft-cited causes. First, there is little reason to believe that marriages became any less happy during this period. We do not have good data to compare marriages then and now, but the best guess is that marital satisfaction did not decline after the 1950s ended. What did change was that people after the 1950s became more willing to seek divorces in marriages that were already unhappy.
Recall our discussion earlier in Chapter 3, about the changing nature of marriage expectations. As individuals expect more and more from marriage, it is more likely that some partnerships would not meet the increased expectations of companionship, romance, sex, and monogamy required for the social construction of the companionate marriage. Shifting forward to the 21st century, and the expectations of role flexibility and personal fulfillment of the individualistic marriage, you can see that it may be more difficult for any one person or partnership to meet these ideals. The greater societal emphasis on personal fulfillment has likely contributed to people ending unhappy marriages.
Sometimes the contemporary women’s movement is blamed for the increase in the divorce rate by making women think marriage is an oppressive institution. The women’s movement emerged in the late 1960s and was capturing headlines by the early 1970s. Although the divorce rate obviously rose after that time, it also started rising several years before the women’s movement emerged. If the divorce rate began rising before the women’s movement started, it is illogical to blame the women’s movement. Instead, other structural and cultural forces must have been at work, just as they were at other times in the last century, as just noted, when the divorce rate rose and fell.
Why, then, did divorce increase during the 1960s and 1970s? One reason is the increasing economic independence of women. As women entered the labor force in the 1960s and 1970s, they became more economically independent of their spouses. When women in unhappy marriages do become more economically independent, they are more able to afford to get divorced than when they have to rely entirely on their spouses earnings (Hiedemann, Suhomlinova, & O’Rand, 1998). At the same time men’s employment opportunities decreased.
When both spouses work outside the home, moreover, it is more difficult to juggle the many demands of family life, especially child care, and family life can be more stressful. Such stress can reduce marital happiness and make divorce more likely. Spouses have less time for each other when both are working outside the home, making it more difficult to deal with problems they may be having.
It is also true that disapproval of divorce has declined since the 1950s, even if negative views of it still remain (Cherlin, 2009). Not too long ago, divorce was considered a deviant act; now it is considered a normal if unfortunate part of life. We no longer say a bad marriage should continue for the sake of the children. But is the growing acceptability of divorce a cause of the rising divorce rate, or is it the result of the rising divorce rate? Or is it both a cause and result? There are bi-directional forces at play with society’s views and individual’s actions.
Another reason divorce rose during the 1960s and 1970s may be that divorces became easier to obtain legally. In the past, most states required couples to prove that one or both had committed actions such as mental cruelty, adultery, or other such behaviors in order to get divorced. Today almost all states have no-fault divorce laws that allow a couple to divorce if they say their marriage has failed from irreconcilable differences (Kneip & Bauer, 2009).
We have just looked at possible reasons for divorce rate trends, but we can also examine the reasons why certain marriages are more or less likely to end in divorce within a given time period. Although, as noted earlier, 40%–50% of all new marriages will probably end in divorce, it is also true that some marriages are more likely to end than others. Family scholars identify several correlates of divorce (Clarke-Stewart & Brentano, 2006; Wilcox, 2009). They include:
- age at marriage: teenagers who get married are much more likely to get divorced than people who marry well into their 20s or beyond
- social class: people who are poor at the time of their marriage are more likely to get divorced than people who begin their marriages in economic comfort, as the stress of poverty causes stress in marriage.
3.7.2 Effects of Divorce and Single-Parent Households
Much research exists on the effects of divorce on spouses and their children, and scholars do not always agree on what these effects are. One thing is clear: divorce plunges many women into poverty or near-poverty (Gadalla, 2008). Many have been working only part time or not at all outside the home, and divorce takes away their spouse’s economic support. Even women working full time often have trouble making ends meet, because, as we saw in earlier chapters, so many are in low-paying jobs.
It is very difficult to separate the effects of divorce from the effects of poverty, but research indicates that poverty may have worse effects on women and children than does divorce. One-parent families headed by a woman for any reason are much poorer ($35,400 median annual income in 2016) than those headed by a man ($55,580 median annual income in 2016). Meanwhile, that same year, the median income of married-couple families was much higher ($85,300). Almost 35.6% of all single-parent families headed by women are poor.
Although the economic consequences of divorce seem clear, what are the psychological consequences for families? Are they better off if a divorce occurs, worse off, or about the same? The research evidence is very conflicting. Many studies find that divorced spouses are, on average, less happy and have poorer mental health after their divorce, but some studies find that happiness and mental health often improve after divorce (Williams, 2003; Waite, Luo, & Lewin, 2009). The post-divorce time period that is studied may affect what results are found: for some people psychological well-being may decline in the immediate aftermath of a divorce, but rise over the next few years.
Parents used to stay together “for the sake of the children,” thinking that divorce would cause their children more harm than good. Studies of this issue generally find that children in divorced families are indeed more likely, on average, to do worse in school, to use drugs and alcohol and suffer other behavioral problems, and to experience emotional distress and other psychological problems (Sun & Li, 2009; Amato & Cheadle, 2008). Children, in general, tend to rebound after the first year following the divorce. However, it is sometimes difficult in these studies to determine whether the effects on children stem from the divorce itself, poverty, or, instead, from the parental conflict that led to the divorce.
The statistics on children and poverty are discouraging (DeNavas-Walt, Proctor, & Smith, 2009). Nineteen percent of children live in families with incomes below the federal poverty threshold, and 41% of children live in households experiencing twice the poverty (double the poverty line) (Koball and Jiang, 2018). Family structure plays a significant role in child poverty, with 41% of children in poverty residing with a single parent compared to the 13% of children in poverty who live with 2 parents.
As with many things, race and ethnicity play an important role: African American, Latino and Native American children are more than two times as likely as non-Latino white children to live in poverty as shown in Figure 3.20.
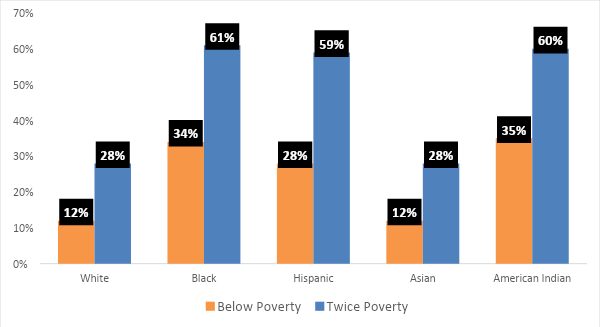
Figure 3.20 Percentage of Children Below Poverty Level by Race-Ethnicity, 2016
Childhood poverty is higher in the United States than in any other post industrial democracy, and poor children in the United States fare worse than their counterparts in other postindustrial democracies (Jäntti, 2009). A major reason for this is that the United States lacks the large, national programs other postindustrial democracies have both for preventing poverty and for helping children and adults already living in poverty. These programs include housing allowances, free or subsidized day care and preschool programs and adequate healthcare. The experience of other postindustrial democracies indicates that the number of U.S. poor children and the problems they face are much higher than they need to be (Waldfogel, 2009).
3.7.3 Licenses and Attributions for Union Dissolution and Divorce
3.7.3.1 Open Content, Shared Previously
Figure 3.19 Data from Infoplease. Retrieved from https://www.infoplease.com/us/marital-status/marriages-and-divorces-1900-2012. Data from “National Center for Health Statistics.” Centers for Disease Control and Prevention, 17 Mar. 2017. Retrieved from https://www.cdc.gov/nchs/fastats/marriage-divorce.htm.
3.7.3.2 All Rights Reserved Content
Figure 3.20 Kobol, Heather, and Yang Jiang. “Basic Facts about Low-Income Children under 18 Years, 2016.” NCCP | Child Poverty, 28 Feb. 2018. Retrieved from http://www.nccp.org/publications/pub_1194.html Used under fair use.
3.7.4 References
Amato, P. R., & Cheadle, J. E. (2008). Parental divorce, marital conflict and children’s behavior problems: A comparison of adopted and biological children. Social Forces, 86(3), 1139–1161.
Cherlin, A. J. (2009). The marriage-go-round: The state of marriage and the family in America today. New York, NY: Knopf.
Cherlin, A. J. (2009). The origins of the ambivalent acceptance of divorce. Journal of Marriage & Family, 71(2), 226–229.
DeNavas-Walt, C., Proctor, B. D., & Smith, J. C. (2009). Income, poverty, and health insurance coverage in the United States: 2008 (Current Population Report P60-236). Washington, DC: U.S. Government Printing Office.
Gadalla, T. M. (2008). Gender differences in poverty rates after marital dissolution: A longitudinal study. Journal of Divorce & Remarriage, 49(3/4), 225–238.
Hiedemann, B., Suhomlinova, O., & O’Rand, A. M. (1998). Economic independence, economic status, and empty nest in midlife marital disruption. Journal of Marriage and the Family, 60, 219–231.
Kobol, Heather, and Yang Jiang. “Basic Facts about Low-Income Children Children under 18 Years, 2016.” NCCP | Child Poverty, 28 Feb. 2018, www.nccp.org/publications/pub_1194.html.
Jäntti, M. (2009). Mobility in the United States in comparative perspective. In M. Cancian & S. Danziger (Eds.), Changing poverty, changing policies (pp. 180–200). New York, NY: Russell Sage Foundation.
Kneip, T., & Bauer, G. (2009). Did unilateral divorce laws raise divorce rates in Western Europe? Journal of Marriage & Family, 71(3), 592–607.
Sun, Y., & Li, Y. (2009). Parental divorce, sibship size, family resources, and children’s academic performance.
Waite, L. J., Luo, Y., & Lewin, A. C. (2009). Marital happiness and marital stability: Consequences for psychological well-being. Social Science Research, 38(1), 201–212.
Waldfogel, J. (2009). The role of family policies in antipoverty policy. In M. Cancian & S. Danziger (Eds.), Changing poverty, changing policies (pp. 242–265). New York, NY: Russell Sage Foundation.
Williams, K. (2003). Has the future of marriage arrived? A contemporary examination of gender, marriage, and psychological well-being. Journal of Health & Social Behavior, 44, 470–487.