
6.2 Representation and Belonging
Social institutions serve a critical function for society and contain a structure of rules and roles. Those roles almost always include some form of representation: a way in which decision-making is streamlined and the participants are somehow “seen” and acknowledged even if they do not directly participate in leadership. Representation means that families know that they belong, that they are important, that their needs are known, and that the institution is functional. If the representation does not serve these purposes, it is unlikely that outcomes will be equitable for families.
In this chapter, we will focus on the institutions of local and national governments. As you read, consider applying these same concepts to other institutions that are important to you, your friends, or your family–including K-12 schools, the college and university systems, health care and health insurance, businesses and corporations, prisons and courts, media, and others.
We will study a couple of the formal ways that families can expect to be represented in the United States and how that representation plays out when we look at equity. This is important because governing bodies make decisions that affect all families; the definitions, laws, and regulations made by governments influence employers, business practices, schools, and other public facilities such as libraries and parks.
6.2.1 Social Identity, Institutions, and Equity
Your social identities affect your experience with representation. In other words, it is likely that you, the reader, see representation through the lens of how well you have typically been represented in this country’s institutions. Any individual’s social identities are multifaceted (refer to the Social Identity Wheel in Chapter 1 and each family member adds additional complexities. This is one of the more beautiful and challenging aspects of family life. It is aspirational to think that we live in a country where every family has equitable access to opportunity and representation. An aspect of this belief is that our representatives “see,” “listen to,” and understand the needs of families that they do not know personally.
For example, this author is a member of the LGBTQ+ community, is White, and is a cisgender female (Figure 6.1). In many organizations, I observe that the majority of the leadership is White. I see many women decision-makers, although the percentage decreases as the level of power increases. And I see relatively few members of the LGBTQ+ community in positions of leadership. Since this part of the population is small (about 10 percent or less), I do not expect a majority of leaders in any organization to be members of this group.
What I hope for is that, regardless of demographic, these leaders still work to understand me and my family. This is especially true of any aspect of my identity that has been marginalized; in my case, that is being a woman and being part of the LGBTQ+ community. I hope that they listen to my stories. I hope that they “see” me. I hope that they work to educate themselves about families like mine, so that even if I don’t see people like myself making the decisions that affect my family, I can trust that they still represent me.
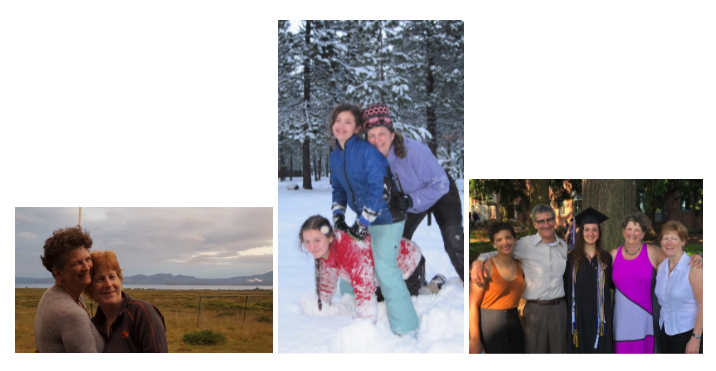
Figure 6.1. Social identities are complex, and every family member adds additional complexities to identity.
When I think about representation from this perspective, I am not only considering the federal government. I am thinking about employers, city councils, my health care insurance and health care providers, the school board, and the local court system. All of these institutions affect families based on their identities and formations. It is important to note that all families are affected by all institutions even if they are not “included” by the institution. In fact, those left out may be most affected. In my case, I was “left out” of the social process of legal marriage, which was historically controlled by state governments and now by federal law.
For example, health care and retirement benefits are typically tied to employers, whether they are public organizations, for-profit corporations, or not-for-profit entities. Those employers will determine which members of my family qualify for benefits and may be listed as beneficiaries of pension or life insurance policies. The school board is making decisions about forms, processes, rights, and responsibilities affecting my children. The local courts and judges interpret laws and make decisions about fostering and adoption, divorce, and custody agreements. In all of these cases, I want to know that the people in the decision-making roles have some understanding of who my family is and who I am, whether or not they share the same social identities. They are representing me, not just as an individual, but as a member of the community that designated them with this power.
Our social identities (including how others define us) affect what kind of representation we have experienced. At the same time, representation continues to contribute to the social construction of identity: color, ethnicity, gender, sex, socioeconomic status, ability, age, and so on. Understanding this relationship can help us increase equity in two ways:
- Reducing the effects of racialization and other forms of stereotyping that contribute to the marginalization of families, and
- Acknowledging the ways that families who are part of the dominant culture benefit from the stereotyping and bias of marginalized groups.
When we talk about families, we are moving far beyond the social construction of the typical family and the ways that government and other institutions define “family” for taxes, health care, and other legal rights and responsibilities. We are including all the ways that people define their own families. It is our aspirational goal to inspire readers to understand injustice more deeply via the ways that we are represented in institutions and to advocate and contribute to changes toward greater equity for families in the United States.
Each one of you who reads this has your own social identities that overlap with the identities within your family. As you read this chapter, consider what representation means to you and how you would like to be represented, included, or not included within the various institutions in which you participate.
6.2.2 The Significance of the U.S. Census
Next, we will look at the U.S. census, a survey that attempts to count all the people—not all citizens, but all people—living in the United States. This survey directly impacts the number of seats that a state has assigned in the U.S. House of Representatives as well as how federal funds are distributed. Then we will look more closely at voting and the resulting elected officials at the local, state, and federal levels. Those officials are directly responsible for the laws and justice systems that govern us. Finally, we will look at an aspect of representation outside of the formal processes: activism and social movements.
6.2.2.1 The Evolution of the U.S. Census
The U.S. census is conducted every 10 years with the goal of counting every person in the country, although, as described below, it is almost impossible to reach this goal. The census collects information about the race, age, and housing situation of the population. The primary purpose of the census, as established in the Constitution, is to determine the number of seats each state will have in the U.S. House of Representatives, the legislative branch of government. Voting district boundaries must then be redrawn in states that have gained or lost seats between census years. Censuses also determine how hundreds of billions of dollars in federal funding are distributed for many important purposes, including education, health care, environmental protection, transportation, and other forms of federal aid to states and cities.
The first U.S. census, carried out in 1791 by sixteen U.S. marshals and 650 assistants, counted around 3.9 million people. They asked only a few questions: the number of free persons, the number of enslaved people, and the sex and race of each individual (Figure 6.2).
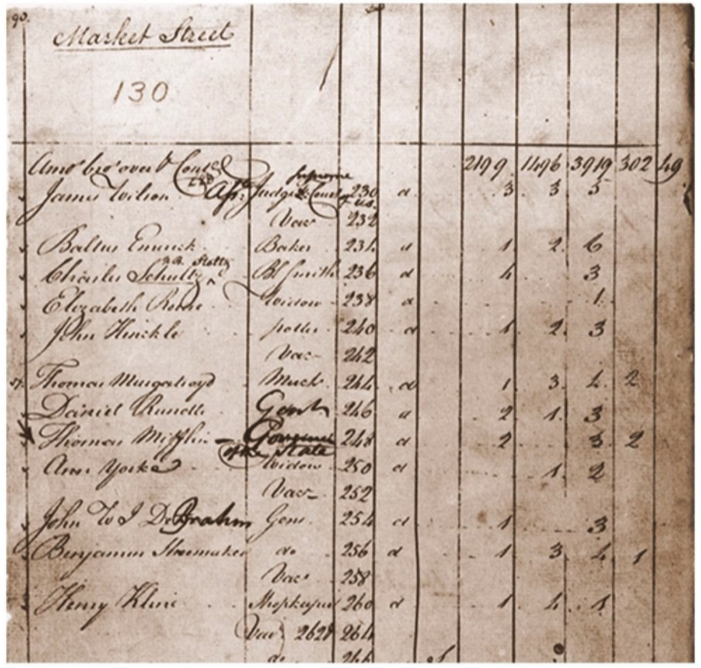
Figure 6.2. Census form 1791. This form for the first census in the United States was filled out by a census taker who asked a few questions.
By 1960, with the population approaching 180 million, it was no longer feasible to have a census taker visit each household. Instead, questionnaires were mailed to every household, and temporary employees followed up in person with the households that did not respond (Figure 6.3).
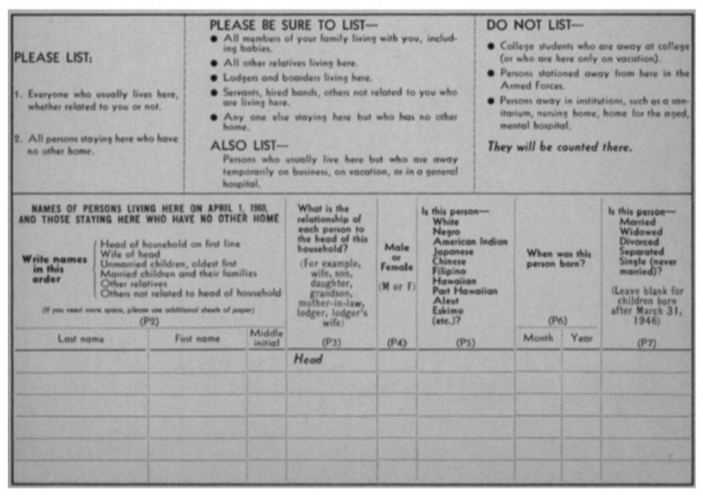
Figure 6.3. Census form 1960. This is a blank copy of the 1960 census form that was mailed to each household to be filled out.
Questions asked of all households now include the number of persons by age, gender, ethnicity, homeownership, and household composition. Between 1940 and 2000, one in six households also received a more detailed “long form” survey which asked questions about a much wider range of topics including income, occupation, commute length, and military service. The Census Bureau then used this sample to estimate the characteristics of the rest of the population.
Demand for more timely social data led to the development of the American Community Survey (ACS), which replaced the long-form census survey in 2010. The ACS is conducted every year in order to provide more frequent “snapshots” of the demographic, economic, and housing characteristics of the population. However, only 2–3 million households receive the survey per year (less than 2 percent of the population), which introduces substantial statistical errors in estimates for the whole population. Data for the census and ACS are collected from each household, but in order to preserve privacy and to make the data easier to use, the Census Bureau aggregates the data into larger geographic areas.
6.2.2.2 Limitations of Census Data
The census is the most comprehensive source of demographic information available for the United States, but it still has important limitations.
The primary challenge is accuracy and undercounting. The census attempts to take a snapshot of how many people there are and where they are living on April 1st of the census year. The method for collecting data assumes that every person lives in a housing unit with a postal address and that they will respond accurately to surveys. The Census Bureau estimated that approximately 10 million people were missed in its 2010 count (Figure 6.4).

Figure 6.4. Census 2010. The first enumeration of the 2010 census took place in Noorvik, Alaska. An early start allows census takers to reach remote villages before residents leave to hunt and fish or travel for warm-weather jobs following the spring thaw.
Undercounting is not random because it is more prevalent in certain areas and subpopulations. Those who are houseless or have unstable housing at the time of the census are often missed. Those residing in remote rural areas can be hard to contact by mail or in person. The census is also less likely to receive responses from those who distrust the government, such as people fearful that their answers will be used by immigration enforcement to deport undocumented family members.
The census is only taken every ten years, and the counts have long-term consequences for states and cities. The accuracy of counts can be very contentious in cash-strapped cities. For example, Detroit challenged the findings of the 2010 census, having come up 40,000 people short of a population cutoff point for many major sources of federal funding. Since under-resourced and marginalized populations are among the hardest to count, districts with the most need are also the most at risk of underfunding and underrepresentation.
Beyond issues of accuracy, census data may be limited due to the topics it does not cover. For example, there are no questions about religion, consumer spending, or political party affiliation. The quantity and wording of questions asked in the census have changed over time, and data are not always available for all places or for all geographic areas.
6.2.2.3 Why the U.S. Census Focuses on Race
Race was emphasized in the first census and the video in Figure 6.5 helps us understand why. It was important related to the number of voters (mostly free White men over the age of 21 years) and the number of elected representatives. The video also describes the changes in how race and ethnicity have been quantified.
Figure 6.5. Why Does the Government Care about Race? [YouTube Video]. This video (10:12) will help you understand why the government cares about race.
Remember the discussion of the social construction of race in the first chapter? The changing definitions of race within the census data are a perfect example of the socially constructed aspect of race. But social constructions have real effects on families and kinship groups. One of the reasons that we continue to quantify race is to track access to resources and the equity of experience for individuals and families.
6.2.2.4 Challenges to Census Participation
The 2020 Census count was ended early by the Trump Administration. Originally scheduled to end on December 30, 2020, all counting ceased on October 31, 2020. The Census Bureau has identified populations that are less likely to participate in the process as “Hard to Count (HTC)” (U.S. Census Bureau, 2019). Have you or your family members participated in the Census? Perhaps your family falls into a group that the Census Bureau identifies as hard to locate, contact, persuade, and/or interview. It is likely that fewer people, primarily in the “hard to count” groups, participated in the 2020 census due to its shortened timeline.
Current events affect participation; increased efforts to limit immigration and other quickly changing laws and policies related to immigrants in recent years may reduce the number of immigrants willing to participate. For example, the Trump administration fought in several legal forums to have a question about citizenship added to the 2020 census, but this question was not added.
Another current event, the COVID-19 pandemic, may affect the number of college students who respond to the census. The main dates for the mailing of census forms were between April 1 and May 13, 2020, at a time when many college students abandoned their regular place of residence (such as dormitory or apartment building in a college town) and went to live with parents or other family members. Towns with large universities may be affected by lower census counts because of this pattern.
Because Census results have a big impact on representation and therefore access to political influence and government resources, people have created organizations designed to encourage Census participation. We Count Oregon is an organization and website that has been developed to persuade everyone to participate in the census. Why? The more people who participate will lead to more federal funding for hospitals, Medicaid, Head Start, parks, roads, and other programs. Oregon is one of five states (Arizona, Colorado, Florida, and North Carolina are the others) predicted to earn an additional seat in the House of Representatives. We Count Oregon identifies HTC communities as including “people of color, children under five, renters, immigrants, people with limited English proficiency, multiple-family homes, Native tribal and urban communities, disabled people, and LGBTQ individuals” (We Count Oregon, n.d.).
If you and your family are wondering if you can make a difference by filling out the census, check out We Count Oregon’s website. It is an opportunity to be more fully represented. Even if you missed the 2020 census, the American Community Survey (which samples a much smaller part of the population) is an opportunity to be counted each year. If you are selected, it is an opportunity to have your family represented by the many scholars, groups, and decision-makers in the United States.
Figure 6.6. The 2020 Census is about Money and Power [Vimeo Video]. This video explains how participating in the Census could help you and your family,
6.2.3 Licenses and Attributions for Representation and Belonging
6.2.3.1 Open Content, Original
“Representation and Belonging” by Elizabeth B. Pearce is licensed under CC BY 4.0.
Figure 6.1. Family photos by Elizabeth B. Pearce. License: CC BY 4.0.
6.2.3.2 Open Content, Shared Previously
“The U.S. Census” is from “Census Data” by Melinda Kernik and Dudley Bonsal in Mapping, Society, and Technology. License: CC BY-NC 4.0.
Figure 6.2. Image by US Census Bureau. Public domain.
Figure 6.3. Image by US Census Bureau. Public domain.
Figure 6.4. Image by US Census Bureau. Public domain.
6.2.3.3 All Rights Reserved Content
Figure 6.5. “Why Does the Government Care about Race?” (c) Origin of Everything. License: Standard YouTube license.
Figure 6.6. “The 2020 Census is about Money and Power” (c) Dancing Hearts Consulting. License: Standard Vimeo license.
6.2.4 References
Jefferson, T. (1776, July 4). Declaration of independence: A transcription. https://www.archives.gov/founding-docs/declaration-transcript
US Census Bureau. (2019, July). Counting the hard to count in a census. https://www.census.gov/content/dam/Census/library/working-papers/2019/demo/Hard-to-Count-Populations-Brief.pdf
We Count Oregon. (n.d.). About #WeCountOregon. Retrieved July 14, 2020, from https://wecountoregon.com/