
10.2 Food and Food Production
Elizabeth B. Pearce and Amy Huskey
“I have the audacity to believe that people everywhere can have three meals a day for their bodies, education and culture for their minds, and dignity, equality and freedom for their spirits.”
— Martin Luther King, Jr.
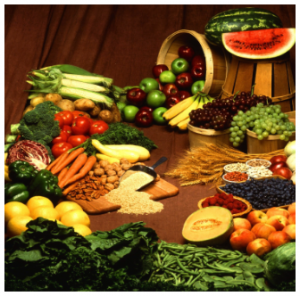
Figure 10.1 Some of the healthiest foods are the most difficult for families to access.
Survivalists have a rule of three: you can survive without food for three weeks, without water for three days, without shelter from a harsh environment for three hours, and without air for three minutes (Wikipedia, n.d.). If a human goes without any of these resources for a long enough time, death will eventually be the result. It stands to reason that when we talk about American families’ needs, we would talk about all of these; in this chapter we will look at both food and water.
Abraham Maslow’s hierarchy of needs theory (1943) describes these physiological needs as being a key motivator in human behavior (Wikipedia, n.d.). Obtaining food, water, shelter, sleep, and oxygen to survive consumes a large amount of our time and resources both directly and indirectly. Think about how much time your family spends working to pay for food. In general, families pay a smaller percentage of their income for food than they did 50 years ago. That’s not because food expenses have decreased, but because other costs, primarily shelter and health care, have increased. We discuss shelter (housing and living environments) in the Housing chapter. Now consider your family’s access to water. While we may not think about paying for it as a percentage of our incomes, access to plentiful, clean, safe water is influenced by where we live. The financial resources that are invested into our community infrastructure, which includes water and sanitation, impact our safety and overall health. Where we live matters when it comes to having available and safe water.
Personal finances are only one part of the cost, benefits, and societal dynamics that play into meeting these basic needs. We must pay attention to where food comes from, business and government investment in food production, and the business of food charity. Time is another cost of food; families decide how much time is spent purchasing, preparing, eating, and cleaning up meals (Figure 10.1). Turning on a faucet to access clean, toxin free drinking water requires building, maintaining, and monitoring water and sanitation systems, and this comes at a cost that not all municipalities can afford. While the federal government has invested in water infrastructure, there is not an ongoing commitment, so these needs must be balanced with competing needs such as schools, parks, police, and libraries. There are variations and influences on how food and water needs are met, but ultimately they must be met in some way.
10.2.1 Food Production and Systems of Oppression
Prior to the formation of the United States, families found food in a variety of ways, including foraging, hunting, fishing, and growing food. As the country progressed toward a formal organizational structure managed by the Euro-American settlers, Native Americans were restricted to designated reservations, often on land that was not as fertile for farming. Food production via farms became a major economic factor. Industrialization created more efficiencies and more wealth for landowners.
It is important to note that these new ways of sourcing food would not have been possible without three institutional structures:
- Oppression of the way of life that Native Americans had established here for thousands of years;
- Enslavement of African immigrants brought to this country for the explicit purpose of free labor without attention to their rights and needs;
- Laws that controlled immigrants from other countries by limiting who could immigrate by gender, familial, and employment status; laws that discriminate based on nationality and immigration status related to wage, housing options, and typeof employment.
These structures affected the functionality of all families in the United States, favoring White families, especially those who owned land. Which of these structures affect families today? If you answered all three, you are correct. Native Americans are still fighting for rights related to their family needs that have been disrupted and restricted; the aftereffects of slavery, including the restrictions of wealth attainment on Black people, affects both the families who were able to accumulate wealth and the ones who were not; and current immigration laws still place the needs of the employers first.
10.2.2 Black Farmers During Reconstruction
Black farmers in America have had a long and arduous struggle to own land and to operate independently. For more than a century after the Civil War, deficient civil rights and various economic and social barriers maintained a system of inequality. Many Black farmers worked as farm operators with a limited and often total lack of opportunity to achieve ownership and independence. Although some formerly enslaved people were deeded land in the “Forty Acres and a Mule” division of lands in 1868, the same land was later deeded back to the original Confederate owners and the Black families became sharecroppers rather than owners. Other Black farm owners saw their properties diminished throughout the 20th century as described in the 15-minute video in Figure 10.2.
Figure 10.2. How Black Americans Were Robbed of Their Land [YouTube Video]. These personal stories help us understand how families that worked hard still were treated unjustly.
Black farmers often ended up working for landowners once again. Even as employees, they received less protection than factory and office workers. When social security and unemployment laws meant to protect workers were passed, they excluded people who worked on farms or as domestic help, of which the majority were immigrants and marginalized groups, including African Americans. Diminished civil rights also limited collective action strategies, such as cooperatives and unions.
It is tempting to think that these past laws and practices do not affect us today. Many of the structures survive, however, in both subtle and obvious ways. In addition, because these structures limited access and land ownership in proximity to the vital resources of food and water, White families were able to build wealth more quickly and easily than any other group of families. We discuss the institutional factors related to housing, location, and wealth in Chapter 8.
10.2.3 Farm and Field Workers
Farm workers are and have been an essential part of the U.S. economy and food system. They come in varying immigration statuses: U.S. citizens or residents, people on guest worker visas, or undocumented workers. The following U.S. Department of Agriculture (USDA) table describes the demographic characteristics of farm workers in the United States in 2018, collected from data on the American Community Survey (part of the Census project) (Figure 10.3). The data shows that about 55 percent of farm laborers are born in countries other than the United States.
10.2.3.1 Social Identities of Workers |
10.2.3.2 Farm laborers, graders, and sorters |
10.2.3.3 Farm managers, inspectors, and supervisors |
10.2.3.4 All other occupations in agriculture |
10.2.3.5 Agriculture: all occupations |
10.2.3.6 All U.S. private wage and salary workers |
|
Percent female |
26 |
13 |
36 |
27 |
45 |
|
Average age in years |
39 |
44 |
42 |
41 |
40 |
|
Percent under age 25 |
20 |
10 |
17 |
18 |
18 |
|
Percent over age 44 |
37 |
50 |
47 |
41 |
41 |
|
Percent married |
48 |
62 |
54 |
51 |
48 |
10.2.3.7 Race/Ethnicity/Ancestry |
|||||
|
Percent White, not Hispanic |
31 |
67 |
61 |
44 |
59 |
|
Percent Black, not Hispanic |
3 |
2 |
3 |
3 |
12 |
|
Percent other, not Hispanic |
2 |
3 |
4 |
3 |
9 |
|
Percent Hispanic: Mexican origin |
57 |
24 |
26 |
44 |
12 |
|
Percent Hispanic: Other |
7 |
4 |
6 |
6 |
8 |
|
Percent born in U.S. (includes Puerto Rico) |
44 |
75 |
76 |
57 |
80 |
|
Percent U.S. citizens |
53 |
84 |
84 |
66 |
90 |
10.2.3.8 Education |
|||||
|
Percent lacking high school diploma |
48 |
19 |
20 |
36 |
9 |
|
Percent with high school diploma (includes equivalency) |
32 |
31 |
31 |
31 |
29 |
|
Percent with at least some college |
21 |
50 |
49 |
32 |
62 |
Figure 10.3. Demographic Characteristics of Farm Workers in the United States in 2018 (U.S. Census Bureau, n.d.). Note: Counts all private sector wage and salary workers employed in the crop, livestock, and agricultural support industries. Source: USDA, Economic Research Service analysis of data from U.S. Department of Commerce, Bureau of the Census, American Community Survey, 2019.
Since this data is gathered from a written survey related to the Census, it is important to note that there is likely some underreporting from groups that are the hardest to reach, including people of color, children under five, renters, immigrants, people with limited English proficiency, multiple-family homes, Native tribal and urban communities, disabled people, people who distrust the government, and LGBTQ+ individuals. The challenges of representation are discussed at length in Chapter 6.
The survey also tells us that the average age for farmworkers is on the rise, and they are more likely to be female. Younger immigrants are less likely to go into farm work than into other professions, so the population is aging. It is hypothesized that as men move toward agricultural employment (rather than working with crops) and there is increased machine usage, women are moving into these jobs.
Immigrants, especially those who are not yet documented or who live in mixed-status families, are more likely to experience poor treatment and be less likely to complain about bad work conditions.
10.2.3.9 In Focus: Field Workers
By Carla Medel, Bachelor’s Degree candidate: Psychology with Spanish and HDFS minors, Oregon State University, 2021. is licensed under CC BY-NC-ND 4.0.
103 degrees Fahrenheit, picking zucchini, I turn to the sound of “water, water, we need water!” and to the woman with the purple bandana and a hurt shoulder on the ground; she had fainted of dehydration. She sits underneath a tree for 15 minutes with a bottle of water that one of our coworkers was able to give her and before I even know it, she is back on the field picking zucchini along my side.
That afternoon as I made my way home, I could not help but to begin crying out of frustration. I was only 16 but I knew that what I had just witnessed was not correct. Feeling hopeless, the next day I no longer wanted to go back to work. What I did instead was go grocery shopping with my mom. When we headed to produce and I saw people grabbing zucchini, the tears came again. They did not know what those .76¢ zucchini really cost. This is my story, but this is definitely not a unique one. Immigrant farm workers in the United States are treated terribly, and with little to no protection, others are ready to take advantage.
10.2.4 Food Factory Workers as Essential Workers
The COVID-19 pandemic has brought necessary attention to the important function of meat production and the preservation of fruits and vegetables in factories. The federal government has determined employees at food factories to be essential workers. Many of these workers are immigrants and people of color.
The authors of this text plan to elaborate on this group of families in future editions of the text. For now, this podcast highlighting the experience of a mother supporting a family of five who works in the Smithfield pork plant in South Dakota illustrates the dilemmas an essential worker faces.
10.2.5 Licenses and Attributions for Food and Food Production
10.2.5.1 Open Content, Original
“Food and Food Production” by Elizabeth B. Pearce and Amy Huskey is licensed under CC BY 4.0.
“In Focus: Field Workers” By Carla Medel, is licensed under CC BY-NC-ND 4.0.
10.2.5.2 Open Content, Shared Previously
Figure 10.1. Photo by Keith Weller/USDA. Public domain.
Figure 10.3. Demographic Characteristics of Farm Workers in the United States in 2018 from the U.S. Census Bureau and in the public domain.
10.2.5.3 All Rights Reserved Content
Figure 10.2. “How Black Americans Were Robbed of Their Land” (c) The Atlantic. License Terms: Standard YouTube license.