
4.3 Changing Demographics
Elizabeth B. Pearce
Population trends which demonstrate changes in lifespan, fertility, and family formation within the United States are connected to the ways that families form and function in their nurturing relationships. These demographic changes are captured via large studies and surveys; most of the data is collected, analyzed, and publicized by the U.S. federal government (or collected separately by the states and then combined.) These big trends help us to understand how families change over time.
4.3.1 Birth, Fertility, and Fecundity Rates
In addition to the interpersonal aspects of caregiving and parenting, it is important to look at the changes that are occurring as the population ages: to birth, fertility and fecundity rates. Many of these changes are similar in other developed countries, but we will focus on the United States.
In general, the population is aging in the United States: people are living longer and fewer children are being born. The birth rate is declining across all education, income, and age levels with just one exception. While older women (ages 45-49) are having more children, this is a very small number in comparison to all the other groups that are having fewer children (Centers for Disease Control and Prevention, 2021).
To read the provisional data for 2020, refer to the Vital Statistics Rapid Release Report (May 2021) from the Centers for Disease Control and Prevention.
The graph in Figure 4.5 demonstrates the number of live births in the United States between 1990 and 2020 (30 years.) The blue line represents the number of actual births in the millions (e.g., there were over 4 million births in 1990 and about 3,600,000 births in 2020.) The green line represents the birth rate per 1,000 women (e.g., there were just over 70 births per 1,000 women in 1990 and 55.8 births per 1,000 women in 2020.)

Figure 4.5. Any way that you measure it, there are fewer babies being born in the United States.
It may be helpful to understand the three different rates that are declining. The birth rate is the number of live births per 1,000 women in the total population. The fertility rate looks more closely at age, and tells us proportionally how many women in a specific age group gave birth compared to the total number of women in that age group. Both of these rates are declining in the United States. In addition, the fecundity rate, which is the rate of women who wish to give birth, who are able to give birth, is declining as well.
Because these rates are declining across all social identities in the United States, it is difficult for researchers to isolate what is contributing to this decline.
4.3.2 Activity: How do cultural and environmental changes contribute to childbearing rates?
In this podcast (47:09), scientists Melissa Kearney and Shanna Swan explain how a combination of economic, medical, social, and environmental factors contribute (Figure 4.6).

- What did you hear that was surprising to you?
- What did you hear that resonates with your own lived or observed experiences?
- What is the difference between the birth, fertility, and fecundity rates?
- Do economics and the environment have significant effects on the birth rate? Are some women affected more than others?
- What is your biggest takeaway from this podcast?
While the fertility rate has been on the decline in the United States since 1960, the health and economic crises related to the COVID-19 pandemic appear to have negatively affected the desire to have children in the United States (“Key facts about fertility in the U.S. before the pandemic,” 2021). Not only has the birth rate dropped lower, but adults are increasingly saying that they don’t expect to have children, or dont expect to have more children. Again, there does not seem to be one deciding factor that influences the decision with the majority of childless adults saying that “they just don’t want to have children” (“Growing share of childless adults in U.S. don’t expect to ever have children,” 2021).
4.3.3 Child Care
Child care is generally presumed to mean “non-maternal” or “non-parental care of young children.” A big question for many is whether regular non-parental care benefits, harms or is neutral to children’s development.
The most comprehensive attempt to answer this question was undertaken by the National Institute of Child Health and Human Development (U.S. Department of Health and Human Services) between 1991 and 2006. In this study over 1,000 children and families participated in research conducted between the birth of the child and approximately ninth grade.Sadly this
study has not been continued or replicated since 2006, but it is by far the most complete look at quantity, quality, and types of child care.

Figure 4.7 Both home and child care environments can contain high quality materials for children to use.
The NICHD Study of Early Childhood and Youth Development (linked here) provides a great deal of basic information about child care, along with detailed findings. The most significant findings were a correlation between a child’s cognitive, language, and social development, their parents’ characteristics, and the quality of the child care that they experienced. Quality related to positive caregiving, as described below.
The more standards a child care setting meets, the more positive the caregiving. The more positive the caregiving, the higher the quality of care and the better the children’s outcomes.
For instance, for young children in care with smaller groups of children cared for by trained caregivers with higher levels of education in a setting with a low adult-to-child ratio, the care provided tends to be warm, attentive, and intellectually stimulating. Children who receive such care are better off developmentally.
In contrast, when groups are large, when there are many children to care for but few caregivers, and the training/ education of caregivers is limited, the care provided tends to be of lower quality, and children’s development is less advanced…
Overall, the study found that children in child care did not develop differently than children who were cared for by their parents. While there were some small advantages to being in child care, parent and family characteristics were more strongly correlated. Quality child care was correlated with these advantages as well.
Quality costs money. As noted above, quality indicators include more adults, smaller groups of children, and teachers who are educated and have access to training. This contributes to what Early Education leader Gwen Morgan pictured in Figure 4.7, called “the child care trilemma”. She advocated for higher quality of care, better wages for teachers, and affordability for parents. She stated that a systemic solution was needed so that child care programs could have all three in order for children to develop well in child care settings (“The Child Care Trilemma,” n.d.).
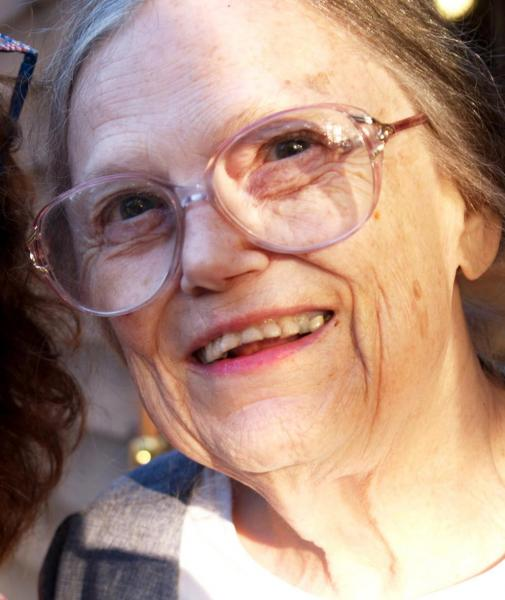
Figure 4.8 Gwen Morgan coined the term “child care trilemma” which identified the tension in parents being able to afford quality child care and workers being paid a living wage.
A weakness of the NICHD study was its limited involvement of children from families with lower socioeconomic statuses. There has been, however, extensive research about the Head Start program, which serves lower income families. Unfortunately not all families who are eligible for Head Start are enrolled, primarily due to lack of funding. It is estimated that about 40 percent of all eligible children are actually served (“Only 42 Percent of Eligible Children Participate in Head Start,” 2013).
It can be said that quality child care can have the potential to improve or maintain a child’s development and outcomes. The NICHD estimated that fewer than 10 percent of children are in such high quality settings and that fewer than 10 percent of children are in the lowest quality settings, with very little positive caregiving. The majority of the children in the United States are in child care that might be described as “fair—between ‘poor’ and ‘good’.”
The lack of quality child care in the United States presents issues of equity. As it has become more necessary for all adults in a household to work, the demand for child care has increased. While there are some programs that help parents to pay for child care, this varies widely across states and even within communities. The quality and quantity of child care is also highly variable. The COVID-19 pandemic has exacerbated these problems. While some families are able to access quality child care that they can afford, many families are left out. This is unlikely to change without a systemic look at the trilemma: workforce needs, attention to quality child care, and livable wages for child care teachers.
4.3.4 Single Parenting, Co-Parenting, and Step-Parenting
Children are growing up in a variety of parenting arrangements that include having one “single” parent, being parented by co-parents who live in different homes, and having additional parents who are not biologically or legally related to them, “step”-parents. And there are variations on these variations! For example, a step-parent may live in the same home, actively parent the child, and may not be legally married to the child’s parent. Or a step-parent may legally adopt the child, effectively becoming the “parent.”
To put it simply, our language and terminology has not caught up with the complexity of family structures that involve children.
In six states, however, laws have been passed that recognize that children may have more than two parental attachment figures. These laws expressly allow courts to recognize more than two parents. With parentage come both rights and responsibilities. These laws give children who have multiple adults in their lives access to all of those adults when disputes or tragedies arise.
For example, a child who might have otherwise been assigned to the foster care system when a parent dies, could have access to another recognized parental figure such as a step-parent, aunt, surrogate mother, or an egg or sperm donor who has been active in the child’s life. In one West Virginia case, this doctrine assigned parental care to both the aunt and uncle who had parented the child, as well as to his legal mother who had rehabilitated herself over a period of 10 years (“The next normal: States will recognize multi parent families,” 2022). This trend points in the direction of the legal system catching up with the complexity of children’s and parents’ lives.
Pew Research conducted a randomized nationally representative study of 1,807 parents in the United States in 2014. While not every family form is captured, this study provides us with an overview of the changing structures of families with children.
The number of children who are living with parents in a first marriage has decreased from 73 percent in 1960 to 46 percent in 2014. That means 26 percent more of 2014’s children have diverse arrangements. Dramatically more children are living with single parents; 9 percent lived with single parents in 1960 and 26 percent lived with single parents in 2014. Seven percent of children lived with cohabiting parents in 2014; this number was zero or unrecorded in 1960 (“Parenting in America,” 2015).
4.3.5 Grandfamilies and Multigenerational Families
To fully understand the increase in multigenerational families (where more than two generations live together) and grandfamilies (where grandparents or great-grandparents provide the primary care for their grandchildren) it is important to note a significant trend in the United States.For centuries, the mortality rate, or the rate of death for a particular group in a particular area, had decreased. While rates vary by gender, race, and ethnicity, overall life expectancy rates increased in the United States between 1860 and 2015.
Since 2015, however, life expectancy has dropped for all genders, races, and ethnicities in the United States, with the most dramatic changes occurring in 2021. These most recent changes have been attributed to negative social trends such as diet, sedentary lifestyles increased medical costs, increased rates of drug use and suicide, and most recently the COVID-19 pandemic.
In spite of this recent change, people in the United States, in general, are living longer. They are also living healthier and more active lives. This, combined with the decrease in fertility, means that older adults have fewer children and grandchildren who are more widely spaced apart by age. This creates a capacity for both more active grandparenting than in previous generations, as well as the possibility of actual parenting of grandchildren and other caregiving relationships.It is believed that the combination of families having fewer children and living longer has led to more involvement by grandparents with their grandchildren. Simply put, people are living long enough to see their grandchildren be born, and to be an active part of their lives.
Interestingly enough, while life expectancy in the United States has been increasing for decades, there has been a big decline in recent years, as shown in Figure 4.9, for both men and for women (CDC, 2021). It is important to note that life expectancy in the United States trails other developed wealthy countries.
Life expectancy is also correlated with race and ethnicity as shown in Figure 4.10. When we consider family life, we can think about both quality of life and length of life. Both of these figures illustrate important trends in life expectancy.

Figure 4.9. While women have had longer life expectancy than men for a long time, both groups face a significant decline between 2019 and 2021 in the United States. Figure 4.9 Image Description
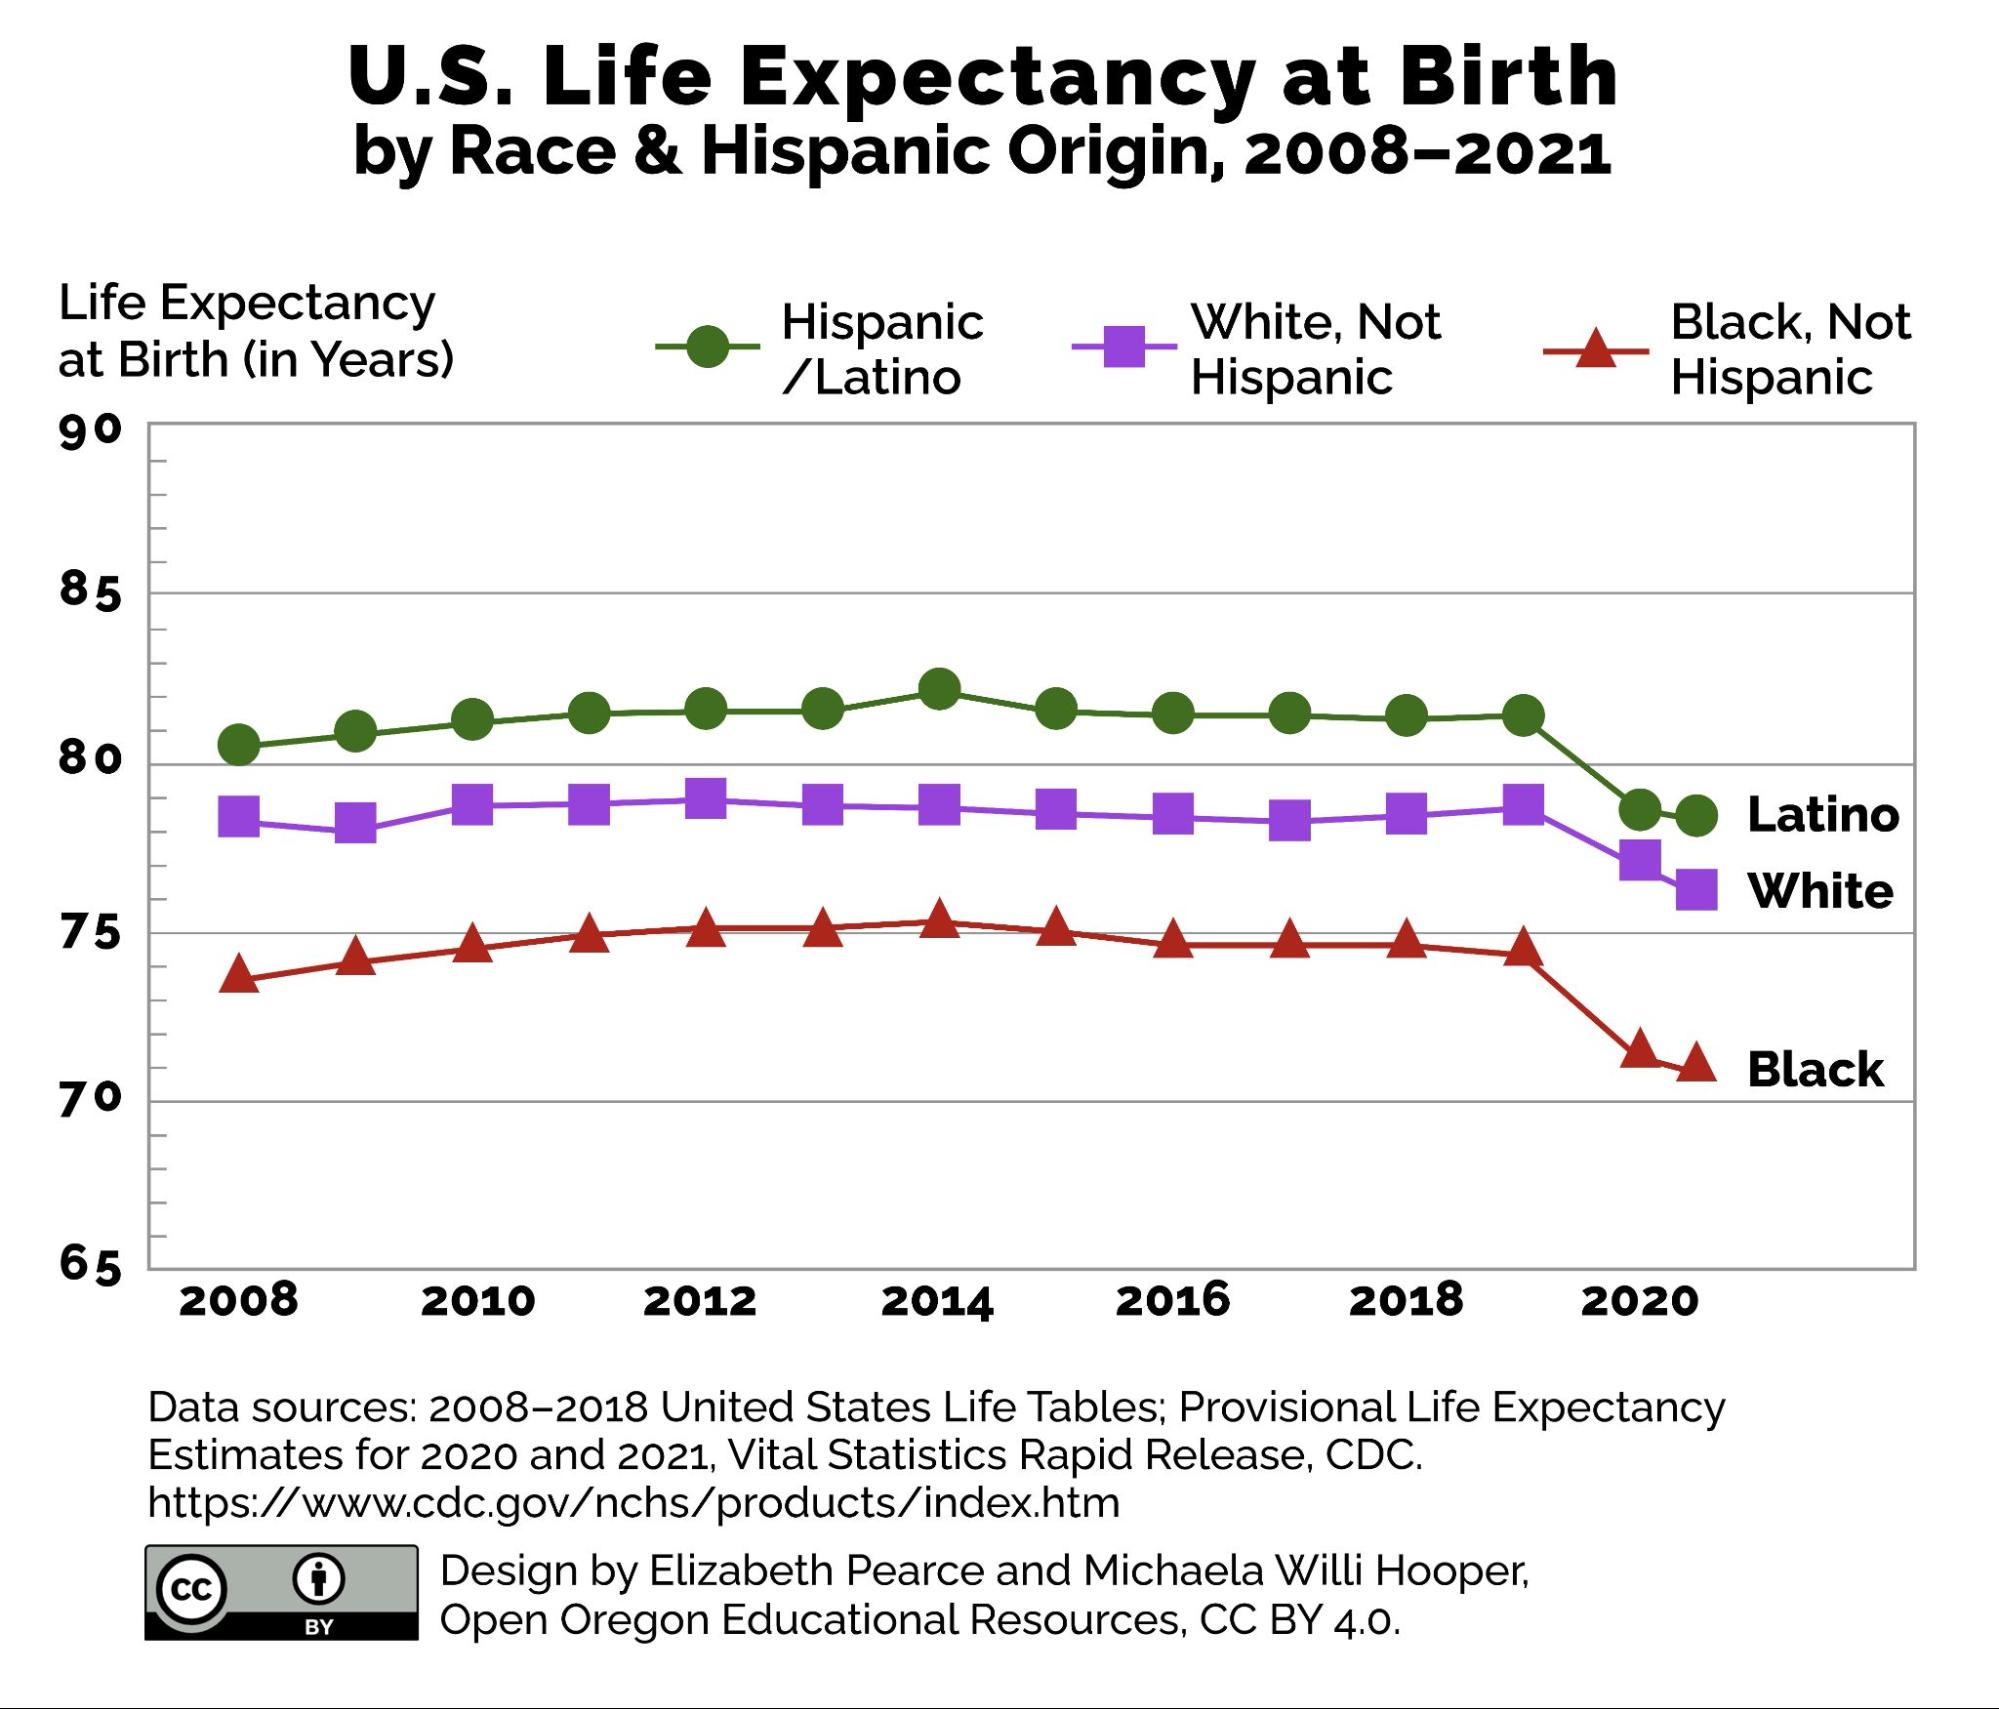
Figure 4.10 While people of all races and ethnicities have seen declines in life expectancy, Latinos and Blacks have seen a more dramatic decline between 2018 and 2020.
While life expectancy is declining, parents may increasingly need help from older relatives. Rates of single parents and divorced parents have increased. These parents may call on their own parents for financial support, child care, shared housing, or other needs. In addition, social problems such as addiction and mass incarceration also contribute to the need for more adults to be involved in parenting. Older adults, including grandparents, are more frequently involved in caregiving and supporting children and grandchildren than ever before. It is important to note that it is not only middle class or wealthy grandparents that are helping out; poor and working class grandparents are struggling to help out their children and grandchildren.

Figure 4.11. Multigenerational families usually include three generations: children, parents, and grandparents. Grandfamilies usually include grandchildren and grandparents, with the skipped generation of parents playing a range of roles from non-involvement to a lot of involvement, but not living in the same household.
Multigenerational households are on the rise after reaching a low of 12 percent in 1980. In 2016 roughly one in five adults (20 percent) lived in a multigenerational household, with an increase being attributed to the economic recession that started in 2009 (“Record 64 million Americans live in multigenerational households,” 2018). The National Association of Realtors reports that multigenerational home purchases increased during the pandemic by four percentage points (“How the Pandemic Accelerated the Rise in Multigenerational Living,” 2020). These trends point out the connection between economic change and living arrangements that affect family relationships and structure.
4.3.6 Licenses and Attributions for Changing Demographics
4.3.6.1 Open Content, Original
“Changing Demographics” including all subsections on this page by Elizabeth B. Pearce is licensed under CC BY 4.0.
Figure 4.5 “Number of Live Births and General Fertility Rate, United States, 1990-2021” by Elizabeth Be. Pearce and Michaela Willi-Hooper is licensed under CC BY 4.0.
Figure 4.9 “U.S. Life Expectancy at Birth, by Sex, 2014–2021” by Elizabeth Pearce and Michaela Willi Hooper is licensed under CC BY 4.0. Data from 2008–2018 United States Life Tables; Provisional Life Expectancy Estimates for 2020 and 2021, Vital Statistics Rapid Release, CDC.
“Activity: How do cultural and environmental changes contribute to childbearing rates?” by Elizabeth B. Pearce is licensed under CC BY 4.0.
Figure 4.10 “U.S. Life Expectancy at Birth by Race & Hispanic Origin, 2008–2021” by Elizabeth Pearce and Michaela Willi Hooper is licensed under CC BY 4.0. Data from 2008–2018 United States Life Tables; Provisional Life Expectancy Estimates for 2020 and 2021, Vital Statistics Rapid Release, CDC.
4.3.6.2 Open Content, Shared Previously
Figure 4.7 Photo by Gautam Arora on Unsplash
Figure 4.11 Boy (13-15) with parents and grandparents by moodboard on flickr.com licensed CC BY 2.0
4.3.6.3 All Rights reserved
Figure 4.6 https://the1a.org/segments/birth-rate-low-america/
Figure 4.8 Willer, Barbara Remembering Gwen Morgan. (2015). NAEYC. from https://www.naeyc.org/resources/blog/remembering-gwen-morgan used under fair use.
4.3.7 References
Image Description for Figure 4.9:
U.S. Life Expectancy at Birth, by Sex, 2014–2021
Line chart visualizing life expectancy at birth, in years.
Data table:
| Year | Females | Males | Total |
|---|---|---|---|
| 2014 | 81.3 | 76.5 | 78.9 |
| 2015 | 81.1 | 76.3 | 78.7 |
| 2016 | 81.1 | 76.2 | 78.7 |
| 2017 | 81.1 | 76.1 | 78.6 |
| 2018 | 81.2 | 76.2 | 78.7 |
| 2019 | 81.4 | 76.3 | 78.8 |
| 2020 | 79.9 | 74.2 | 77.0 |
| 2021 | 79.1 | 73.2 | 76.1 |
Data sources:
Life Expectancy at Birth, by Sex: 2014–2018 data table; Provisional Life Expectancy Estimates for 2020 and 2021, Vital Statistics Rapid Release, CDC.
Licensing information:
Design by Elizabeth Pearce and Michaela Willi Hooper, Open Oregon Educational Resources, CC BY 4.0.