
Drawing the Poverty Line
Learning Objectives
- Explain economic inequality and how the poverty line is determined
- Analyze the U.S. poverty rate over time, noting its prevalence among different groups of citizens
Comparisons of high and low incomes raise two different issues: economic inequality and poverty. Poverty is measured by the number of people who fall below a certain level of income—called the poverty line—that defines the income needed for a basic standard of living. Income inequality compares the share of the total income (or wealth) in society that is received by different groups; for example, comparing the share of income received by the top 10% to the share of income received by the bottom 10%.
In the United States, the official definition of the poverty line traces back to a single person: Mollie Orshansky. In 1963, Orshansky, who was working for the Social Security Administration, published an article called “Children of the Poor” in a highly useful and dry-as-dust publication called the Social Security Bulletin. Orshansky’s idea was to define a poverty line based on the cost of a healthy diet.
Her previous job had been at the U.S. Department of Agriculture, where she had worked in an agency called the Bureau of Home Economics and Human Nutrition. One task of this bureau had been to calculate how much it would cost to feed a nutritionally adequate diet to a family. Orshansky found that the average family spent one-third of its income on food. She then proposed that the poverty line be the amount needed to buy a nutritionally adequate diet, given the size of the family, multiplied by three.
The current U.S. poverty line is essentially the same as the Orshansky poverty line, although the dollar amounts are adjusted each year to represent the same buying power over time. The U.S. poverty line in 2015 ranged from $11,790 for a single individual to $25,240 for a household of four people.
Figure 1 shows the U.S. poverty rate over time; that is, the percentage of the population below the poverty line in any given year. The poverty rate declined through the 1960s, rose in the early 1980s and early 1990s, but seems to have been slightly lower since the mid-1990s. However, in no year in the last four decades has the poverty rate been less than 11% of the U.S. population—that is, at best about one American in nine is below the poverty line. In recent years, the poverty rate appears to have peaked at 15.9% in 2011 before dropping to 14.5% in 2013. Table 1 compares poverty rates for different groups in 2011. As you will see when we delve further into these numbers, poverty rates are relatively low for whites, for the elderly, for the well-educated, and for male-headed households. Poverty rates for females, Hispanics, and African Americans are much higher than for whites. While Hispanics and African Americans have a higher percentage of individuals living in poverty than others, most people in the United States living below the poverty line are white.
Visit this website for more information on U.S. poverty.

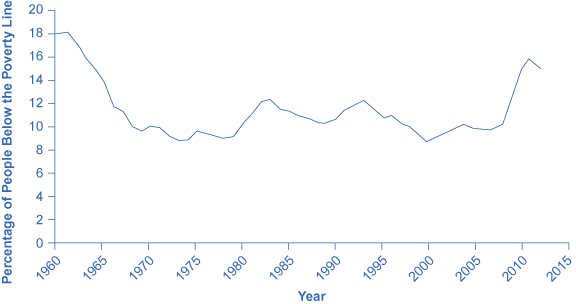
Figure 1. The U.S. Poverty Rate since 1960. The poverty rate fell dramatically during the 1960s, rose in the early 1980s and early 1990s, and, after declining in the 1990s through mid-2000s, rose to 15.9% in 2011, which is close to the 1960 levels. In 2013, the poverty dropped slightly to 14.5%. (Source: U.S. Census Bureau)
| Group | Poverty Rate |
|---|---|
| Females | 15.8% |
| Males | 13.1% |
| White | 9.6% |
| Black | 27.1% |
| Hispanic | 23.5% |
| Under age 18 | 19.9% |
| Ages 18–24 | 20.6% |
| Ages 25–34 | 15.9% |
| Ages 35–44 | 12.2% |
| Ages 45–54 | 10.9% |
| Ages 55–59 | 10.7% |
| Ages 60–64 | 10.8% |
| Ages 65 and older | 9.5% |
| Table 1. Poverty Rates by Group, 2013 | |
The concept of a poverty line raises many tricky questions. In a vast country like the United States, should there be a national poverty line? After all, according to the Federal Register, the median household income for a family of four was $102,552 in New Jersey and $57,132 in Mississippi in 2013, and prices of some basic goods like housing are quite different between states. The poverty line is based on cash income, which means it does not take into account government programs that provide assistance to the poor in a non-cash form, like Medicaid (health care for low-income individuals and families) and food aid. Also, low-income families can qualify for federal housing assistance. (These and other government aid programs will be discussed in detail later in this chapter.)
Should the poverty line be adjusted to take the value of such programs into account? Many economists and policymakers wonder whether the concept of what poverty means in the twenty-first century should be rethought. The following Clear It Up feature explains the poverty lines set by the World Bank for low-income countries around the world.
How is poverty measured in low-income countries?
The World Bank sets two poverty lines for low-income countries around the world. One poverty line is set at an income of $1.25/day per person; the other is at $2/day. By comparison, the U.S. 2015 poverty line of $20,090 annually for a family of three works out to $18.35 per person per day.
Clearly, many people around the world are far poorer than Americans, as Table 2 shows. China and India both have more than a billion people; Nigeria is the most populous country in Africa; and Egypt is the most populous country in the Middle East. In all four of those countries, in the mid-2000s, a substantial share of the population subsisted on less than $2/day. Indeed, about half the world lives on less than $2.50 a day, and 80 percent of the world lives on less than $10 per day. (Of course, the cost of food, clothing, and shelter in those countries can be very different from those costs in the United States, so the $2 and $2.50 figures may mean greater purchasing power than they would in the United States.)
| Country | Share of Population below $1.25/Day | Share of Population below $2.00/Day |
|---|---|---|
| Brazil (in 2009) | 6.1% | 10.8% |
| China (in 2009) | 11.8% | 27.2% |
| Egypt (in 2008) | 1.7% | 15.4% |
| India (in 2010) | 32.7% | 68.8% |
| Mexico (in 2010) | 0.7% | 4.5% |
| Nigeria (in 2010) | 68.0% | 84.5% |
| Table 2. Poverty Lines for Low-Income Countries, mid-2000s. (Source: http://data.worldbank.org/indicator/SI.POV.DDAY) | ||
Any poverty line will be somewhat arbitrary, and it is useful to have a poverty line whose basic definition does not change much over time. If Congress voted every few years to redefine what poverty means, then it would be difficult to compare rates over time. After all, would a lower poverty rate mean that the definition had been changed, or that people were actually better off? Government statisticians at the U.S. Census Bureau have ongoing research programs to address questions like these.
Summary
Wages are influenced by supply and demand in labor markets, which can lead to very low incomes for some people and very high incomes for others. Poverty and income inequality are not the same thing. Poverty applies to the condition of people who cannot afford the necessities of life. Income inequality refers to the disparity between those with higher and lower incomes. The poverty rate is what percentage of the population lives below the poverty line, which is determined by the amount of income that it takes to purchase the necessities of life. Choosing a poverty line will always be somewhat controversial.
References
Ebeling, Ashlea. 2014. “IRS Announces 2015 Estate And Gift Tax Limits.” Forbes. Accessed March 16, 2015. http://www.forbes.com/sites/ashleaebeling/2014/10/30/irs-announces-2015-estate-and-gift-tax-limits/.
Federal Register: The Daily Journal of the United States Government. “State Median Income Estimates for a Four-Person Household: Notice of the Federal Fiscal Year (FFY) 2013 State Median Income Estimates for Use Under the Low Income Home Energy Assistance Program (LIHEAP).” Last modified March 15, 2012. https://www.federalregister.gov/articles/2012/03/15/2012-6220/state-median-income-estimates-for-a-four-person-household-notice-of-the-federal-fiscal-year-ffy-2013#t-1.
Luhby, Tami. 2014. “Income is on the rise . . . finally!” Accessed April 10, 2015. http://money.cnn.com/2014/08/20/news/economy/median-income/.
Meyer, Ali. 2015. “56,023,000: Record Number of Women Not in Labor Force.” CNSNews.com. Accessed March 16, 2015. http://cnsnews.com/news/article/ali-meyer/56023000-record-number-women-not-labor-force.
Orshansky, Mollie. “Children of the Poor.” Social Security Bulletin. 26 no. 7 (1963): 3–13. http://www.ssa.gov/policy/docs/ssb/v26n7/v26n7p3.pdf.
The World Bank. “Data: Poverty Headcount Ratio at $1.25 a Day (PPP) (% of Population).” http://data.worldbank.org/indicator/SI.POV.DDAY.
U.S. Department of Commerce: United States Census Bureau. “American FactFinder.” http://factfinder2.census.gov/faces/nav/jsf/pages/index.xhtml.
U.S. Department of Commerce: United States Census Bureau. “Current Population Survey (CPS): CPS Table Creator.” http://www.census.gov/cps/data/cpstablecreator.html.
U.S. Department of Commerce: United States Census Bureau. “Income: Table F-6. Regions—Families (All Races) by Median and Mean Income.” http://www.census.gov/hhes/www/income/data/historical/families/.
U.S. Department of Commerce: United States Census Bureau. “Poverty: Poverty Thresholds.” Last modified 2012. http://www.census.gov/hhes/www/poverty/data/threshld/.
U.S. Department of Health & Human Services. 2015. “2015 Poverty Guidelines.” Accessed April 10, 2015. http://www.medicaid.gov/medicaid-chip-program-information/by-topics/eligibility/downloads/2015-federal-poverty-level-charts.pdf.
U.S. Department of Health & Human Services. 2015. “Information on Poverty and Income Statistics: A Summary of 2014 Current Population Survey Data.” Accessed April 13, 2015. http://aspe.hhs.gov/hsp/14/povertyandincomeest/ib_poverty2014.pdf.
Glossary
- income inequality
- when one group receives a disproportionate share of total income or wealth than others
- poverty
- the situation of being below a certain level of income needed for a basic standard of living
- poverty line
- the specific amount of income needed for a basic standard of living
- poverty rate
- percentage of the population living below the poverty line
the situation of being below a certain level of income needed for a basic standard of living
the specific amount of income needed for a basic standard of living
when one group receives a disproportionate share of total income or wealth than others
percentage of the population living below the poverty line