
13.3 – The Corn Model: Simple Reproduction
Learning Objectives
By the end of this section, you will be able to:
- Interpret a basic corn model in both its equation and graphical forms
- Solve for relative prices in a system with simple reproduction
Imagine a simple economy that only produces two things: corn to eat and steel for making tools. This economy, then, has two sectors, corn and steel, each of which will use both products: workers in both sectors will eat corn, and corn will be used as seed to make more corn; and steel will be used for the tools necessary to farm the corn as well as to produce more steel.
Let’s get more specific on that. Suppose that, in a given year, it takes 70 tons of corn to feed the corn farmers and to seed the year’s corn crop. And suppose also that it takes 3 tons of steel to make the farming implements–plows and so on–to produce the corn crop. And finally, let’s say that the corn sector produces 100 tons of corn per year.
Now, for the steel sector, let’s say it takes 30 tons of corn to feed the steelworkers and 2 tons of steel to make and maintain the tools necessary to keep making steel. And let’s say the steel sector produces 5 tons of steel per year. We can write these as:
[latex]70 \text{ corn} + 3\text{ steel} → 100 \text{ corn}[/latex]
[latex]30 \text{ corn} + 2 \text{ steel} → 5 \text{ steel}[/latex]
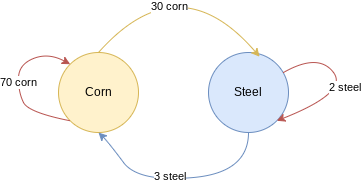
Or we can represent the interaction graphically as in Figure 1. Notice that the two sectors are connected by the quantities of their output used by the other sector.
One basic question raised by this setup: is this economy viable? By that we mean, are the two sectors producing enough corn and steel to be able to run the production process again next year? To answer this we simply have to compare how much corn and steel is being used to how much is being produced. The corn sector consumes 70 tons of corn while the steel sector consumes 30, and the corn sector is producing 100 tons of corn. Then, yes, the corn sector is producing exactly enough corn to supply both sectors next year. Looking to steel, it appears that a total of 5 tons of steel are used between the two sectors, and the steel sector is producing 5 tons of steel. So, good news! This hypothetical economy of ours is producing enough of both products to supply itself with the corn and steel it will need to continue producing in the future. The economy is viable–it’s a going concern, at least in this technical sense.
But remember, in a capitalist economy products move from producers to consumers through markets. This means that the prices those products sell at are important–ultimately, they will determine whether or not each sector can afford to purchase the inputs it needs. Fortunately, the information we already have, about how much steel and corn it takes to produce the steel and corn outputs, is enough to tell us something about those prices. Specifically, we can say that, whatever the price of corn, steel must cost 10 times that amount, per ton. This will ensure that the dollar value of the corn and steel the two sectors produce will be sufficient for each of those sectors to purchase the inputs it needs to continue producing into the future.
Determining prices for a viable economy
In the example above, we know that 70 tons of corn and 3 tons of steel will make 100 tons of corn, and that 30 tons of corn and 2 of steel will make 5 tons of steel. We also saw that this economy produces exactly enough corn and steel to continue production in the future. Because of this latter point, determining the relative price of corn to steel (or steel to corn) is fairly simple: we just need to solve one of the equations. Let’s take the second equation:
[latex]30 \text{ corn} + 2 \text{ steel} = 5 \text{ steel}[/latex]
Subtracting both sides by 2 steel gives:
[latex]30 \text{ corn} = 3 \text{ steel}[/latex]
And dividing both sides by three simplifies the equation to:
[latex]10 \text{ corn} = 1 \text{ steel}[/latex]
This tells us that 1 ton of steel is worth 10 tons of corn. Suppose, then, that you’ve got a ton of steel priced at $200. In this case, for the economy to be viable in the sense that both sectors will be able to afford the inputs they need to produce in the future, 10 tons of corn must also cost $200–that is, the value of one ton of steel is equal to the value of 10 tons of corn. And, of course, if 10 tons of corn costs $200, then 1 ton of corn must go for $20.
Let’s test that looking back to our original numbers for inputs and outputs in our two sectors.
[latex]70 \text{ corn} + 3 \text{ steel} → 100 \text{ corn}[/latex]
[latex]30 \text{ corn} + 2 \text{ steel} → 5 \text{ steel}[/latex]
If corn costs $20 and steel costs $200, then the corn sector is spending [latex]70 \text{ tons} \times $20 \text{ per ton} = $1,400[/latex] on corn, and [latex]3 \times 200 = $600[/latex] on steel. So the corn sector’s total costs come out to $2,000. Is it producing enough corn to cover those costs? Since it produces 100 tons of corn, which sells for $20 per ton, then yes, the corn sector is generating $2,000 in revenues, exactly enough to cover its costs.
We can check the steel sector the same way. Costs are [latex]30 \times $20[/latex] for corn, plus [latex]2 \times $200[/latex] for steel, which comes out to $1,000. And the steel sector produces 5 tons of steel, worth $200 per ton, making its revenues exactly $1,000.
Notice that the specific prices don’t really matter; all we’re really concerned about is that the relative prices between the two products hold. That is, so long as the price of steel is 10 times the price of corn–whether that’s $200 versus $20, or $4,000 versus $400–, then the economy should remain viable.
