
8.4 – How the U.S. and Other Countries Experience Inflation
Learning Objectives
By the end of this section, you will be able to:
- Identify patterns of inflation for the United States using data from the Consumer Price Index
- Identify patterns of inflation on an international level
In the last three decades, inflation has been relatively low in the U.S. economy, with the Consumer Price Index typically rising 2% to 4% per year. Looking back over the twentieth century, there have been several periods where inflation caused the price level to rise at double-digit rates, but nothing has come close to hyperinflation.
Historical Inflation in the U.S. Economy
Figure 1 (a) shows the level of prices in the Consumer Price Index stretching back to 1913. In this case, the base years (when the CPI is defined as 100) are set for the average level of prices that existed from 1982 to 1984. Figure 1 (b) shows the annual percentage changes in the CPI over time, which is the inflation rate.
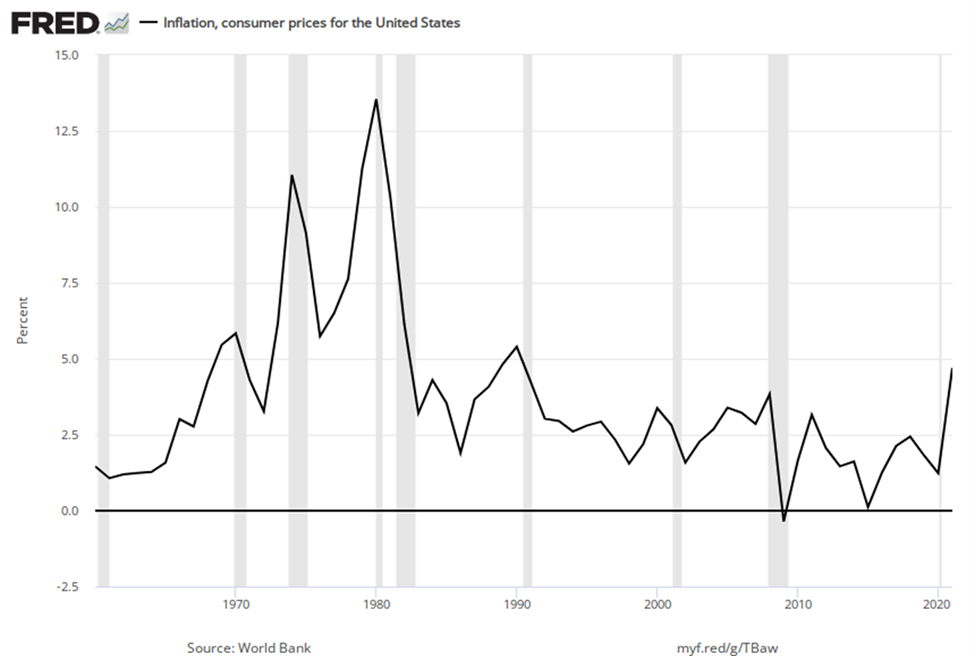
Figure 1. U.S. Price Level and Inflation Rates since 1960. Inflation picked up in the late 1960s and hit its highest levels in 1974 and 1980. After that, inflation in the U.S. was relatively mild, until the COVID-19 pandemic and following years.
The first two waves of inflation are easy to characterize in historical terms: they are right after World War I and World War II. However, there are also two periods of severe negative inflation—called deflation—in the early decades of the twentieth century: one following the deep 1920-21 recession of and the other during the 1930s Great Depression of the 1930s. (Since inflation is a time when the buying power of money in terms of goods and services is reduced, deflation will be a time when the buying power of money in terms of goods and services increases.) For the period from 1900 to about 1960, the major inflations and deflations nearly balanced each other out, so the average annual rate of inflation over these years was only about 1% per year. A third wave of more severe inflation arrived in the 1970s and departed in the early 1980s.
Times of recession or depression often seem to be times when the inflation rate is lower, as in the recession of 1920–1921, the Great Depression, the recession of 1980–1982, and the Great Recession in 2008–2009. There were a few months in 2009 that were deflationary, but not at an annual rate. High levels of unemployment typically accompany recessions, and the total demand for goods falls. This may have the effect of pulling prices downward, although this is disputed. Conversely, the rate of inflation sometimes, but not always, seems to start moving up when the economy is growing very strongly, like right after wartime or during the 1960s.
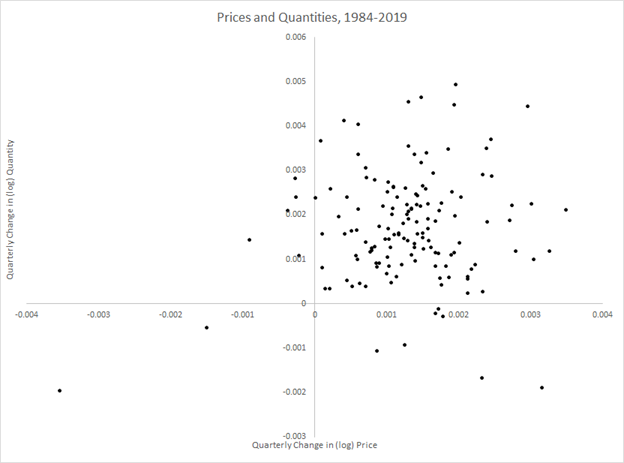
Looking into the data more carefully suggests two distinct periods for the cyclicality of prices–that is, how the price level moves over the business cycle—in the U.S. after World War II. As figure 2 below indicates, between the end of WWII and the early 1980s the price level tended to move in the opposite direction of movements in output. This suggests that, while prices of different goods and services certainly don’t all move together, in general the price level of somewhat countercyclical—that is, inflation was higher in recessions than expansions. Since the 1980s, however, the correlation appears to have broken down, suggesting acyclical prices, or no stable correlation between inflation and the business cycle (although the years of the COVID-19 pandemic look to be a new period of as-yet-unknown duration).
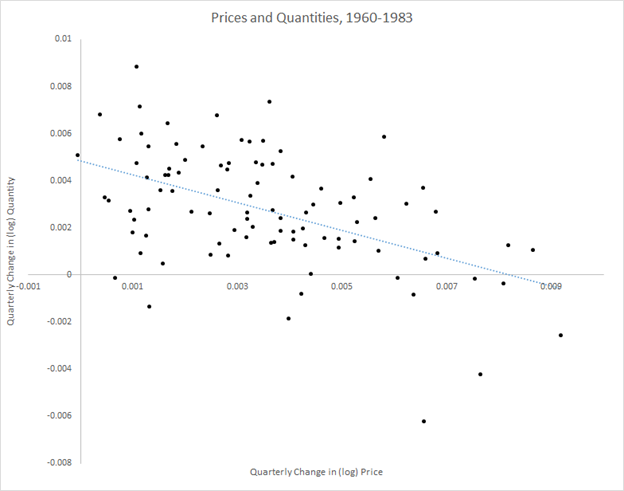
The frameworks for macroeconomic analysis that we develop in other chapters will give different explanations for the relationship between changes in aggregate output and inflation.
Inflation around the World
Around the rest of the world, the pattern of inflation has been very mixed; Figure 2 shows inflation rates over the last several decades. Many industrialized countries, not just the United States, had relatively high inflation rates in the 1970s. For example, in 1975, Japan’s inflation rate was over 8% and the inflation rate for the United Kingdom was almost 25%. In the 1980s, inflation rates came down in the United States and in Europe and have largely stayed down.
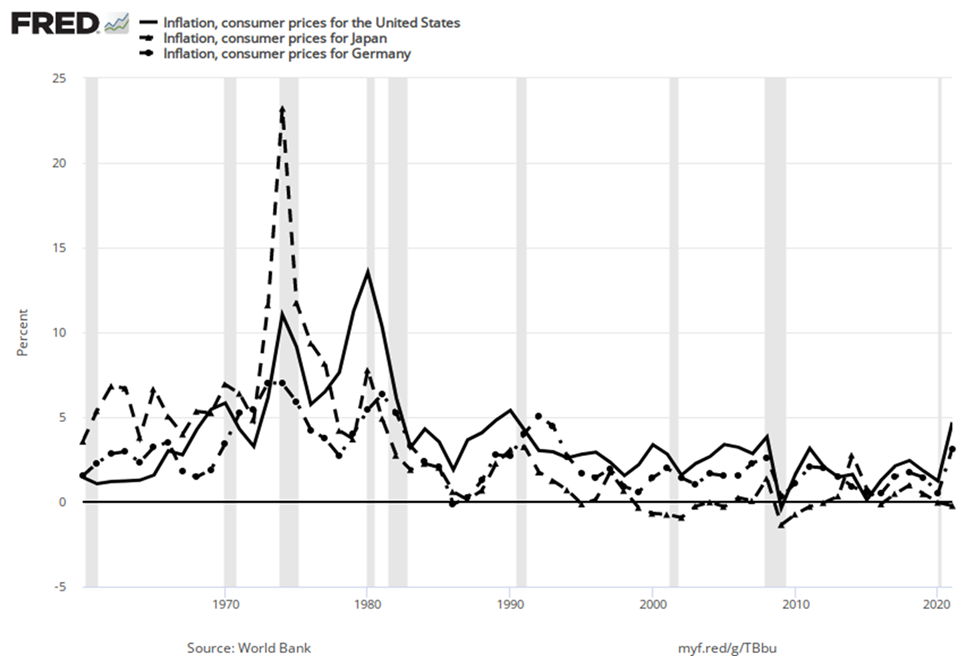
Figure 3. Countries with Relatively Low Inflation Rates, 1960–2016. This chart shows the annual percentage change in consumer prices compared with the previous year’s consumer prices in the United States, Japan, and Germany.
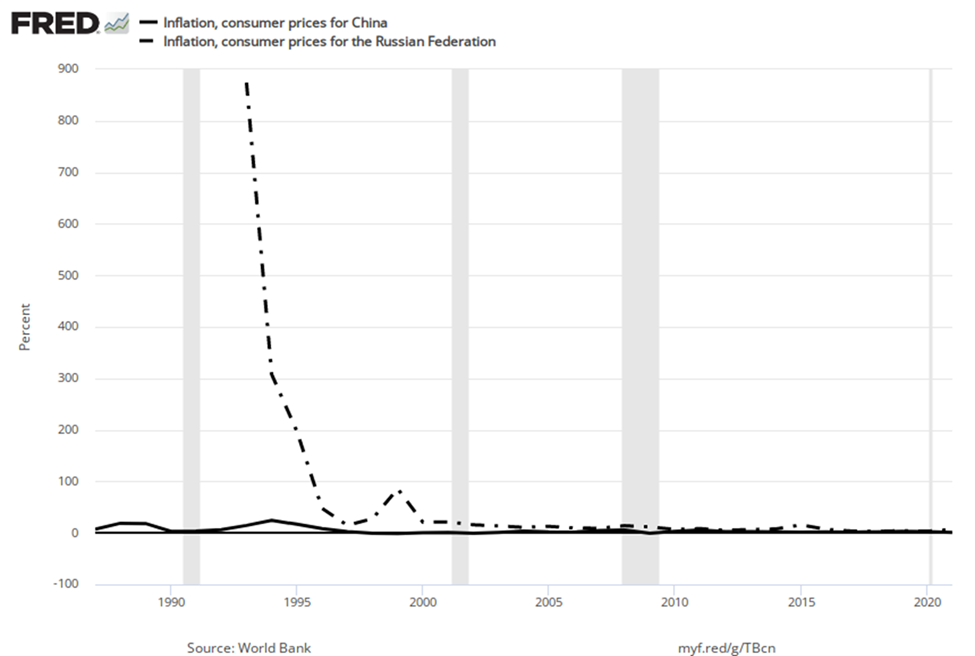
Countries with controlled economies in the 1970s, like the Soviet Union and China, historically had very low rates of measured inflation—because prices were forbidden to rise by law, except for the cases where the government deemed a price increase to be due to quality improvements. However, these countries also had perpetual shortages of goods, since forbidding prices to rise acts like a price ceiling and creates a situation where quantity demanded often exceeds quantity supplied. As Russia and China made a transition toward more market-oriented economies, they also experienced outbursts of inflation, although we should regard the statistics for these economies as somewhat shakier. Inflation in China averaged about 10% per year for much of the 1980s and early 1990s, although it has dropped off since then. Russia experienced hyperinflation—an outburst of high inflation—of 2,500% per year in the early 1990s, although by 2006 Russia’s consumer price inflation had dipped below 10% per year, as Figure 4 shows. The closest the United States has ever come to hyperinflation was during the 1860–1865 Civil War, in the Confederate states.
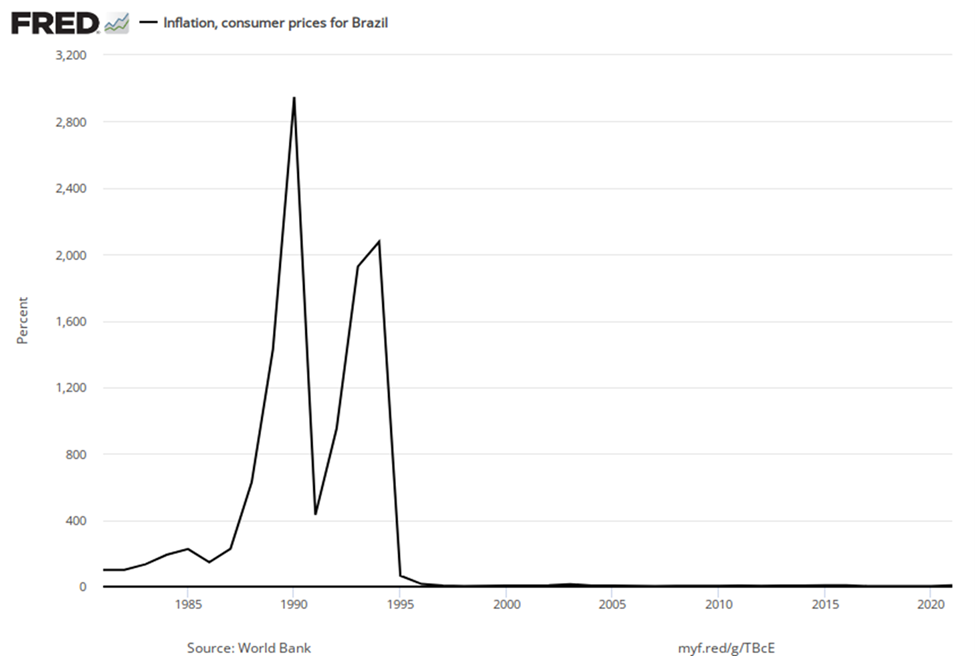
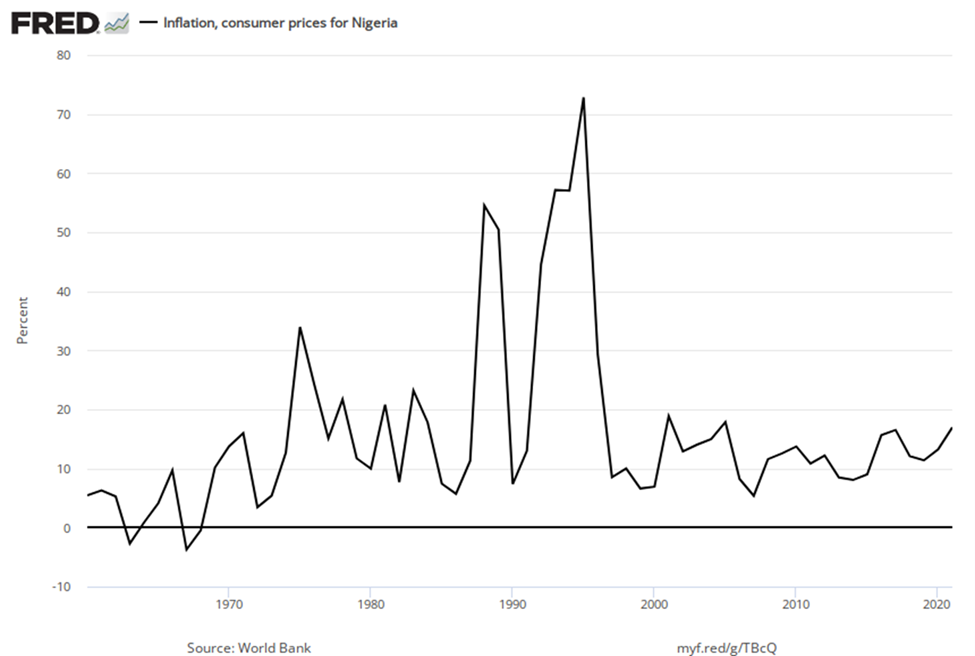
Many countries in Latin America experienced raging inflation during the 1980s and early 1990s, with inflation rates often well above 100% per year. In 1990, for example, both Brazil and Argentina saw inflation climb above 2000%. Certain countries in Africa experienced extremely high rates of inflation, sometimes bordering on hyperinflation, in the 1990s. Nigeria, the most populous country in Africa, had an inflation rate of 75% in 1995.
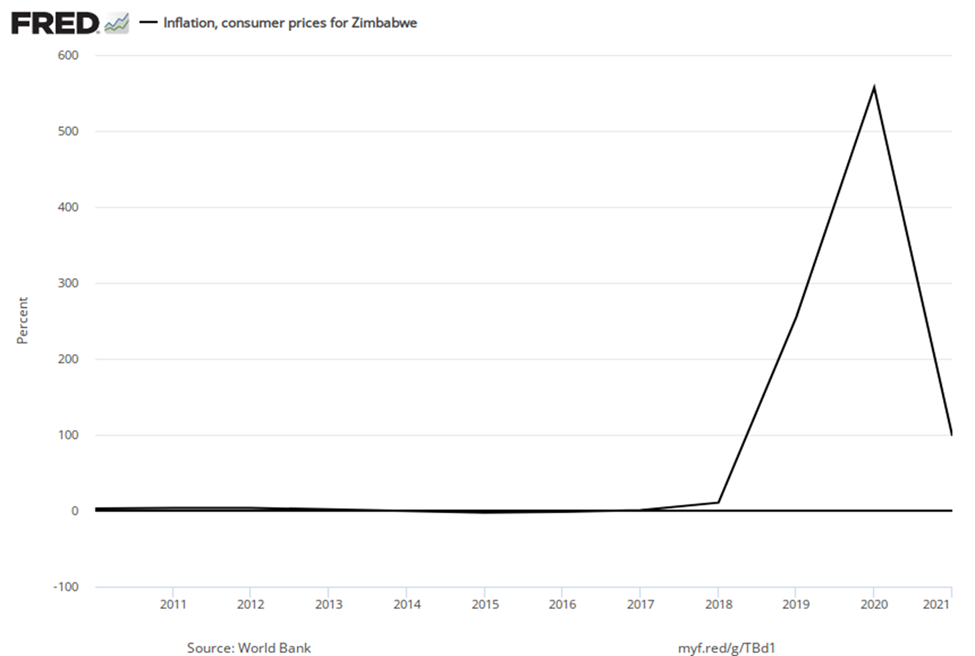
In the early 2000s, the problem of inflation had diminished for most countries, at least in comparison to the worst times of recent decades. As we noted in an earlier Bring it Home feature, in recent years, the world’s worst example of hyperinflation was in Zimbabwe, where at one point the government was issuing bills with a face value of $100 trillion (in Zimbabwean dollars)—that is, the bills had $100,000,000,000,000 written on the front, but were almost worthless. In many countries, the memory of triple-digit and even quadruple-digit inflation is not very far in the past, while most countries have experienced a fresh round of inflation, albeit more modest, from the COVID-19 pandemic.
Summary
In the U.S. economy, the annual inflation rate in the last two decades has typically been around 2% to 4%. The periods of highest inflation in the United States in the twentieth century occurred during the years after World Wars I and II, and in the 1970s. The period of lowest inflation—actually, with deflation—was the 1930s Great Depression.
Glossary
- deflation
- negative inflation; most prices in the economy are falling
- hyperinflation
- an outburst of high inflation that often occurs (although not exclusively) when economies shift from a controlled economy to a market-oriented economy
negative inflation; most prices in the economy are falling
an outburst of high inflation that often occurs (although not exclusively) when economies shift from a controlled economy to a market-oriented economy
