23 Pupillary Distance Self-Measurement
You may have heard the old adage “measure twice and cut once”. Scientists take this concept to the extreme, so the saying would be more like: “measure 50 times, then calculate the average and determine the possible uncertainty. Next cut a cheap piece of cardboard to the average size and test to make sure that it fits first, then finally cut the board. After you put the board in place, evaluate the goodness of fit, then think about how you could get an even better fit next time. Oh yeah, and write everything down along the way so you or anyone else can come along and follow the same process every time.” You might not make 50 measurements in your everyday life, but you can still use the concepts of error, precision, accuracy, and uncertainty to save yourself time, energy, and trouble.
Everyday Example
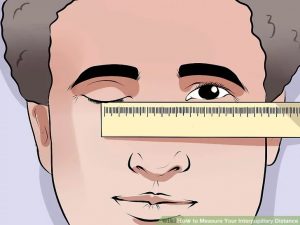
Tyler recently had an eye exam and his prescription changed. He has decided to order his new eyeglasses online to save money. He can upload a photo of his prescription, but he needs to provide his pupil distance, or PD and this is not written on the prescription. This is a common problem so the company website has a video explaining that PD is the distance between your pupils, measured in millimeters (mm) and showing how to measure PD using a ruler and a mirror.

Tyler tries the measurement and finds that the ruler is pretty far below his pupil and his pupil is several mm wide, so it’s hard to line up the edge of the ruler with the center of one pupil and it’s also hard to tell which mark on the ruler lines up best with the center of his other pupil. Even worse, his eye and the ruler both move a bit during the measurement. Tyler doesn’t want to get his PD wrong and have to hassle with sending the glasses back.
Tyler makes several measurements and gets 56 mm, 57 mm, and 54 mm and he is uncertain of the actual value. He decides that because the marks on the ruler are only 1 mm apart the ruler likely isn’t reason he is getting such different values. The instrument is not affecting his precision much, so it must be his method instead.
Tyler considers making a mark on his face just below one pupil that he can use to line up the edge of the ruler. That might help his precision. After thinking more about it, Tyler realizes that if his mark wasn’t in the perfect spot then this would introduce a systematic error into the measurement and that would affect his accuracy.
Instead of making a mark, Tyler decides not to worry about the precision and focus on getting a more accurate result. Tyler thinks it’s likely that difficulty in lining up the ruler makes his measurement sometimes too short and sometimes too long, so he takes more measurements and averages all of the results to improve his accuracy. He makes four more measurements, getting 56 mm, 55 mm, 57 mm and 58 mm. Then he takes the average of all seven results:
![]()
The website for ordering glasses only let Tyler enter whole mm values, so he had to decide between 56 mm or 57 mm. Tyler’s calculated average was closer to 56 mm so he entered that along with his prescription.
Sometimes scientists report uncertainty as percentages of the result. For Tyler’s example we would divide the uncertainty by the result and the multiply by 100 to find the percent uncertainty before writing it behind the result:
![]()
Finding percent uncertainty is an important step in some of the more sophisticated methods of determining the total uncertainty in the result of a calculation that uses several numbers that each have uncertainties themselves. This text won’t get into those sophisticated methods, but if you are curious you can read about some of them in Section 1.3 of OpenStax College Physics.
In addition to the methods we just discussed, Scientists sometimes report uncertainty in other ways, such as confidence intervals. Typically this method states 95% confidence that an actual value lies within the interval between two values. For example, this 25-year and 7-country study on cigarette smoking and mortality risk found that the hazard risk for all causes of death was 1.3x higher for smokers than non-smokers with a 95% confidence that the value was between 1.2x and 1.4x. (The risk was 1.8x higher for smokers of more than 10 cigarettes a day and even higher for death caused by coronary heart disease, all stroke, other arterial disease, lung cancer, other cancer, chronic obstructive pulmonary disease, and other disease in smokers[2].
- "Expert Reviewed How to Measure Your Interpupillary Distance" by WikiHow is licensed under CC BY-NC-SA 3.0 ↵
- "Cigarette smoking and mortality risk: twenty-five-year follow-up of the Seven Countries Study" by Jacobs DR Jr, Adachi H, Mulder I, Kromhout D, Menotti A, Nissinen A, Blackburn H., U.S. National Library of Medicine, U.S. Department of Heath and Human Services ↵
Amount by which a measured, calculated, or approximated value could be different from the actual value
Measurement Error (also called Observational Error) is the difference between a measured quantity and its true value. It includes random error (naturally occurring errors that are to be expected with any experiment) and systematic error (caused by a mis-calibrated instrument that affects all measurements)
refers to the closeness of two or more measurements to each other
refers to the closeness of a measured value to a standard or known value
an error having a nonzero mean (average), so that its effect is not reduced when many observations are averaged. Usually occurring because
there is something wrong with the instrument or how it is used.

