
86 Wind-Chill Factor
As stiff breeze can feel refreshing on a hot day and make a cool day feel quite cold. This phenomenon is known as the wind chill effect or just wind chill. Wind chill is a significant factor in thermal injuries such as hypothermia and frost bite, which is tissue damage caused by the formation of ice crystals within the tissue. The wind chill chart above shows what calm air temperature would be necessary to produce the same heat loss rate as the actual air temperature plus wind combination. The chart is makes this calculation specifically for the skin on a human face. The chart also shows the exposure time which is likely to result in frostbite. For example, a day with 10 °F air temperature and 10 mph wind would feel as cold as a -7 °F day without wind.
Everyday Example
The author grew up in a small remote town on the tundra in Western Alaska. School was cancelled on days when the wind chill was less than -75 °F. According to the windchill chart, school could be cancelled on a -30 °F day with 55 mph wind or on a -45 °F day with 15 mph wind. Both of these combinations were entirely possible in Bethel, Alaska and growing up we usually had one or two wind chill cancellation days per year.
Forced Convection
In the absence of wind, a layer of warm air will form next to your skin, which effectively provides an additional layer of insulation known as a boundary layer. The thermal image below color-codes warm and cool air so that we can visualize the formation of the warm boundary layer. (In the next chapter we will learn how thermal images like this one are created.)

We can see that the skin-warmed layer is thin, but air has a very low thermal conductivity, so this layer can make and important contribution to slowing conduction. Wind tends to partially strip this insulating layer away and replace it with cooler air. The thickness of the warm boundary layer that is able to form depends on the wind speed, with higher speeds leading to thinner layers and causing greater wind chill effect. Wind chill is an example of forced convection, in which warm and cold fluid exchange places due to fluid motion caused by external factors such as blowing wind or flowing water.
Everyday Example: Hot Springs and Saunas
When submerged in fluid with a temperature higher than body temperature, such as in a hot spring or sauna, you may notice that the fluid suddenly feels hotter when you move around. Whether a fluid moves around you, or you move through the fluid, forced convection will occur in either case. When the fluid is warmer than your body then heat transfers out of the fluid into your body, leaving a slightly cooler boundary layer of fluid next to your skin. When you move this boundary layer gets left behind and replaced with new hot fluid that has not yet been cooled down by your body.
The rate of heat transfer by forced convection can be calculated using an empirical equation that looks very similar to the conduction equation:
(1) 
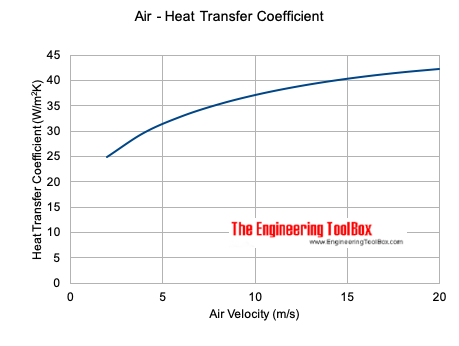
Once again the heat transfer rate is proportional to a difference between the object and environment temperatures. Contact surface area (A), again plays a role, in this case between the object and the fluid. Finally the convective heat transfer coefficient (h) incorporates fluid properties and accounts for the dependence of boundary layer thickness on fluid speed. The convective heat transfer coefficient is often determined experimentally. For example, the following graphs shows experimental data on the heat transfer coefficient for air at a range of wind speeds:
Reinforcement Exercises
Everyday Example: Cold Weather Survival
Cutting down on wind chill (forced convection) is an important part of the overall cold weather survival strategy. Let’s evaluate the effects of forced convection during a wilderness survival situation at 25 °F (-3.9 °C) with a 10 mph (4.5 m/s) wind. Let’s assume you are wearing thin fabrics that are fairly permeable to wind. Now we can approximate the effect of convection by assuming the fabric surface is the same as body temperature and applying the convection equation:

The difference between body temperature and the air temperature is 37 °C – (-3.9 °C) = 40.9 C°. The heat transfer coefficient is about  according to the previous graph. Using the methods in Chapter 17 we estimate the surface of the upper body to be
  . Entering these values into the convection equation:

The convective heat loss rate in this situation would completely overwhelm the 100 W resting thermal power of a typical person and body temperature would drop quickly. To see how quickly, check out the Heat Capacity chapter. Shivering can boost the thermal power by up to 2.5 times, to rougly 250 W[4], but even that would fall well short of balancing the convective heat loss rate. Finding shelter from the wind is an important part of the survival strategy. Carrying wind-stopping clothing is an important part of being prepared in the wilderness. Even a large plastic trash bag that could be worn over most of the body would significantly cut down on heat loss by convection.
Natural Convection
Wind will not penetrate a well-sealed window, so it seems like forced convection should not be a significant factor in the heat loss through a window. However, a single pane of glass does a poor job of preventing conduction, so significant thermal energy still crosses the barrier. That thermal energy will warm up a boundary layer on the outside of the window, which could then be stripped away by wind, so in fact wind chill may affect the rate of heat loss through the window. Double pane windows reduce conduction by using a layer of trapped air between two panes of glass.
We know that conduction is reduced across a double pane window because the thermal conductivity of air is exceptionally low, but the air gap in a double pane windows is typically only about 2 cm. Considering that the rate of heat transfer by conduction decreases as the thickness of the air layer increases, why don’t double pane windows have a much larger gap? Why not minimize conduction by making the gap almost the full thickness of the wall? Natural convection is the answer to that question. Natural convection is transfer of heat due to fluid movement caused by thermal expansion of the fluid itself, rather than by external factors such as wind. For example, you warm the air next to your skin and that air expands. After expanding, that same mass of air now has a larger volume, thus by definition it has a lower density. Being less dense than the surrounding cooler air, the warm air will float upward, as you can see in the previous thermal image of a person’s hand. (To remind yourself why the warmer and less dense air will rise, see the earlier chapter on buoyant forces).
As the warmed air rises away from the skin it is replaced by cool air moving in from each side of the warm surface, which is then warmed before rising, creating a cyclic flow pattern known as a convection cell. Overall the convection cells transport thermal energy away from the skin (or any warm object).
Using double pane windows with a large air gap would allow for large convection cells to form and those cells would efficiently transfer thermal energy across the gap. Keeping the gaps size small prevents large convection cells from forming.
Everyday Examples: Down, double-pane windows, fiberglass and fur
Most insulation strategies create a fiber matrix that traps small pockets of air to exploit its low thermal conductivity while preventing large convection cells from forming. Down, fiberglass batting, and fur are examples of this strategy. The fibers of these materials have conductivity greater than air, so trapping more air with fewer fibers provides the lowest overall average conductivity. In fact, some animals, such as polar bears, have hollow fur to increase the ratio of air to matrix material.[6] The best insulation strategies combine an air trapping matrix to minimize conduction and natural convection with a wind-stopping outer coating to prevent forced convection. In wet climates the wind-stopping layer should also be water proof to prevent water from filling the air pockets created by the underlying fiber matrix.
Wind Power
Convection cells drive heat transfer in a wide variety of systems on many scales. In fact the wind that serves to drive forced convection from your body is actually caused by natural convection cells. Such cells can form due to differential heating and cooling of the local geography. For example, the air above the ocean may remain cooler while the air above the coast warms rapidly during the day, resulting in an on-shore breeze (sea breeze) during the day. The convection cell reverses at night, creating an offshore breeze.
Reinforcement Exercises
Draw the convection cells near a coastline both during the day and at night in order to show how on-shore and off-shore breezes are created by differential heating of ocean and coastline. Indicate the relative temperature of the water, land and air during day and night.
Wind is also produced by global scale convection cells. The following graphic shows the global-scale convection cells that drive the winds at various latitudes. Notice that the spinning of the Earth combined with the inertia of the air mass creates a Coriolis Effect, which causes the wind direction to curve away from the direction indicated at the bottom of the convection cell. You may notice that the latitudes of the great deserts and forests of the world match up with the boundaries between the cells. We will learn why in the next chapter.

The predictability and stability of large scale convection cells allows for the growing implementation of wind turbine power plants. As our predictive skills continue to improve, along with turbine efficiency and energy storage technology, wind power is becoming a viable option for some communities.

Tectonic Movement
Convection cells are even responsible for moving the continents:

- "Wind Chill Chart" by National Weather Service, NOAA is in the Public Domain ↵
- "Thermal Plume from human hand" by Gary Settles [CC BY-SA 3.0 (https://creativecommons.org/licenses/by-sa/3.0)], from Wikimedia Commons ↵
- Engineering ToolBox, (2003). Convective Heat Transfer. [online] Available at: https://www.engineeringtoolbox.com/convective-heat-transfer-d_430.html [Accessed 18 1. 2019] ↵
- "Nutritional Needs In Cold And In High-Altitude Environments: Applications for Military Personnel in Field Operations" byAndrew J. Young, Michael N. Sawka and Kent B. Pandolf, National Center for Biotechnology Information, National Institutes of Health ↵
- OpenStax, College Physics. OpenStax CNX. Nov 8, 2018 http://cnx.org/contents/031da8d3-b525-429c-80cf-6c8ed997733a@14.4 ↵
- "Is Polar Bear Fur Transparent?" by Everyday Mysteries, The Library of Congress is in the Public Domain ↵
- Burbo Bank Offshore WindFarm by Ian Mantel [CC BY-SA 4.0 (https://creativecommons.org/licenses/by-sa/4.0)], via Wikimedia Commons ↵
Increase in rate of heat loss from objects that are warmer than air caused by the flow of air across the object surface.
The condition of having a body temperature well below the normal range.
transfer of heat due to the movement of fluid molecules driven by external factors other than thermal expansion.
mathematical explanation of the relation between measured values that is used for making predictions
a rough value obtained without making a measurement by using prior knowledge and assumptions.
ignoring some compilation of the in order to simplify the analysis or proceed even though information is lacking
rate at which chemical potential energy is converted to thermal energy by the body, batteries, or heat engines. Also, rate at which thermal energy is converted to electrical energy by a thermal power plant.
Transfer of heat due to fluid movement caused by thermal expansion of the fluid
The increase change in volume of an object resulting from a change in temperature.
a measurement of the amount of matter in an object made by determining its resistance to changes in motion (inertial mass) or the force of gravity applied to it by another known mass from a known distance (gravitational mass). The gravitational mass and an inertial mass appear equal.
a quantity of space, such as the volume within a box or the volume taken up by an object.
relation between the amount of a material and the space it takes up, calculated as mass divided by volume.
cyclic fluid flow caused by natural convection
An amount of thermal energy transferred due to a difference in temperature.
