
25 Unit 2 Review, Practice, and Assessment
Learner Objectives
- Explain the scientific cycle and the role of empirical models, physical models, hypotheses, observations, experiments, theories, laws, and principles. [5]
- Explain how systematic and random errors affect precision, accuracy and uncertainty.[4]
- Estimate and report uncertainties in specific measurements and calculated results. [4]
- Take actions to reduce the uncertainty in specific measurements or results. [4]
Outcome 1
1) What are the steps in the basic scientific process?
2) Read the summary (abstract) of this 25-year, 7-country smoking and mortality study and identify and explain to someone else the following features of the study: observation, question, hypothesis, test method, analysis method, reported uncertainty or confidence interval, and conclusions.
3) Explain how you could you apply the basic scientific method to a question from your everyday life. Be sure to identify how you would complete each step: observation, question, hypothesis, test method, analysis method, reported uncertainty or confidence interval, and conclusions.
4) How is the scientific method related to the modern scientific process?
5) Provide an example of each of the following: empirical model, physical model, hypothesis, theory, and law. List any sources you used to find examples.
6) State which of the following categories the ideas listed below fall under: empirical model, physical or mechanistic model, hypothesis, theory, or law. List any sources you used to help you decide.
- Foreign organisms were thought to be present inside tumors (microscopic studies never found evidence of this).
- Due to genetic instability, successive mutations, appearing in cells, lead to selection of cancer cells which feature specific phenotypic traits[1].
- Natural Selection
- All living organisms consist of membrane encased cells
- Plate Tectonics
- Statistical relationships are found between measured forest fire smoke exposure and other available air quality data. Those relationships are used to predict forest fire smoke exposure in geographic areas where it’s not easily measured[2].
Outcome 2
7) Would putting larger tires on a vehicle introduce random or systematic error into the speedometer reading? Would this affect the accuracy or precision (or both) of the speedometer? Explain your answers.
8) Would a wiggling baby introduce random or systematic error into a measurement of its weight? Would this affect the accuracy or precision (or both) of the weight measurement? Explain your answers.
9) Would slightly under-filling measuring cups to prevent spilling ingredients introduce random or systematic error into the measurement of ingredient volumes? Would this affect the accuracy or precision (or both) of the measurement volumes. Explain your answers.
10) A set of measurements of a physical quantity was made for comparison to an accepted standard value. The data were plotted in graphs with the measured values on the horizontal axis and the number of times each value occurred on the vertical axis. This type of graph is known as a histogram and the data on the vertical axis are called the frequencies. Use the histograms below to answer the questions that follow.
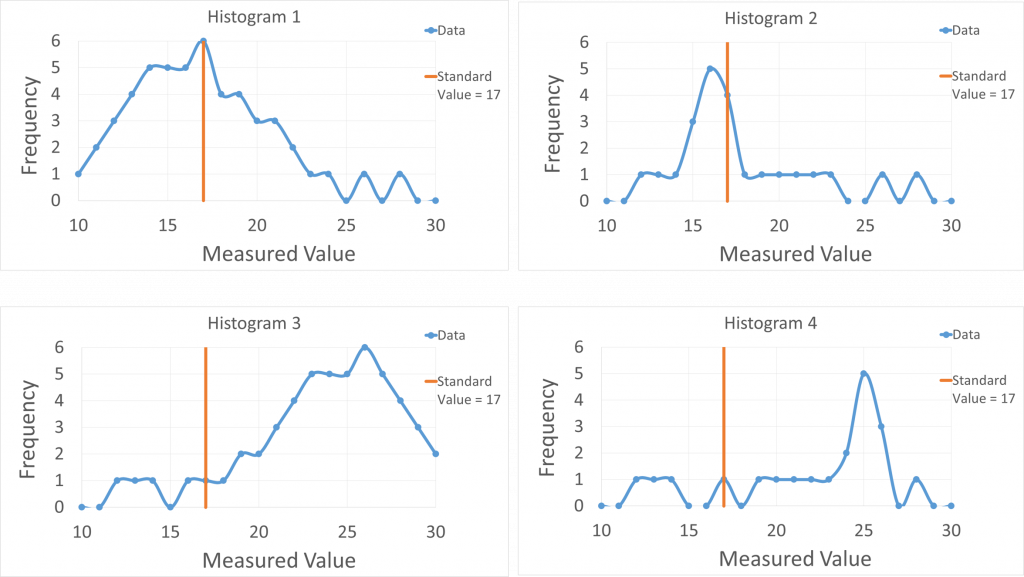
a) For each histogram state whether the data suggest the measurements were relatively accurate, precise, both, or neither. Explain your reasoning.
b) For each histogram state what types of errors were likely to be relatively significant: random, systematic, both or neither. Explain your reasoning.
Outcome 3
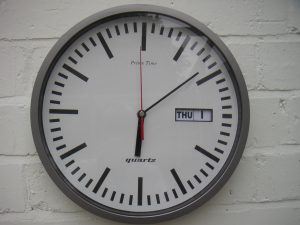
11)A person measures his or her heart rate by counting the number of beats in 30 s as timed using a clock on the wall, such as the one in the image below. They start counting when the second hand jumps onto a particular tick mark (say the 12) and then stop counting when it jumps to the opposite mark (say the 6). A reasonable estimate of the uncertainty in the time measurement would be which of the values listed below? Explain your reasoning.
a) 0.05 s
b) 0.5 s
c) 5 s
d) 50 s
12) Estimate the uncertainty in counting the beats in the previous problem. Explain your reasoning.
*13) If 47 beats were counted by the person in the previous problem, what a was their heart rate in BPM in correct significant figures. Indicate the total % uncertainty and total uncertainty.
Outcome 4
14) Considering the heartbeat measurement described in the previous few problems, explain some changes to the measurement procedure that would reduce the uncertainty in the measurement without the need for any different equipment.
- "Evolving models of tumor origin and progression" by Iwona Mitrus, Ewa Bryndza, Aleksander Sochanik, and Stanisław Szala, U.S. National Library of Medicine, U.S. Department of Health and Human Services ↵
- "An empirical model to estimate daily forest fire smoke exposure over a large geographic area using air quality, meteorological, and remote sensing data" by Jiayun Yao and Sarah B Henderson, Journal of Exposure Science and Environmental Epidemiology, Nature Research ↵
- Clock By Lee Haywood from Wollaton, Nottingham, England (Clock) [CC BY-SA 2.0 (https://creativecommons.org/licenses/by-sa/2.0)], via Wikimedia Commons ↵
a method of procedure that has characterized natural science since the 17th century, consisting in systematic observation, measurement, and experiment, and the formulation, testing, and modification of hypotheses
mathematical explanation of the relation between measured values that is used for making predictions
mechanistic explanation of how a physical system works
a proposed explanation made on the basis evidence that can be supported or refuted by the result of experimentation
an explanation of an aspect of the natural world that can be repeatedly tested and verified in accordance with the scientific method using accepted standard protocols
a statement, usually in the form of a mathematical equation, that summarizes, but not explains, the results of repeated experiments or observations that describe some aspect of the natural, usually within a certain range of application.
A graph of relating how often a value falls within a certain range.
Amount by which a measured, calculated, or approximated value could be different from the actual value
