
105 Gel Electrophoresis and DNA Fingerprinting
Gel Electrophoresis
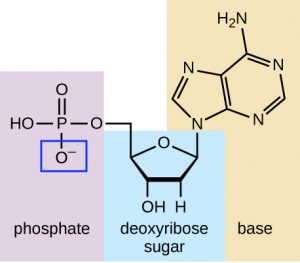
DNA is a very negatively charged molecule because each phosphate group in each nucleotide has a negative charge (Figure 1). This means that if an electric current is run through a DNA sample, the DNA molecules will move towards the positive charge of the current. Scientists take advantage of this property of DNA in order to separate DNA molecules by size.
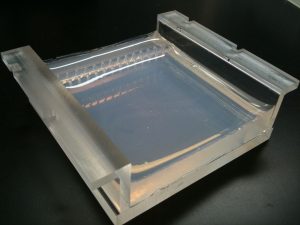
Agarose is a molecule that is purified from seaweed. Agarose powder is mixed with water, then heated until the powder dissolves. The mixture is poured into a tray (Figure 2) and allowed to cool. As it cools, it forms a semi-solid gel. This process is similar to making Jell-o, if you’ve ever done that. This gel contains microscopic pores (holes) of different sizes. You can imagine the gel structure as looking like a thick hedge or blackberry bush. The structure of a hedge or blackberry bush is similar to the polysaccharide matrix that makes up an agarose gel (many molecules criss-crossed every which way).
DNA can be drawn through the agarose gel using an electric current because the negatively charged DNA molecules are attracted to a positively charged electrode. Small DNA molecules (short nucleotide chains made of a small number of base pairs) are able to move relatively rapidly through the gelatinous agarose matrix. In contrast, large DNA molecules (long nucleotide chains made of a large number of base pairs) move much more slowly. You can compare the movement of DNA through an agarose gel to the movement of animals of different sizes (representing the DNA) through the thick hedge or blackberry bush (representing the structure of the agarose gel). Small animals, such as rabbits, can move quickly through a blackberry bush just like short DNA molecules can move quickly through the agarose gel. Medium-sized animals, such as German Shepherds, move much more slowly than rabbits. Large animals, such as cows, wouldn’t be able to move very quickly through a blackberry bush at all. We can use this separation of DNA molecules by size to determine how large DNA molecules are within a sample. We can also compare the sizes of DNA molecules within several different samples.
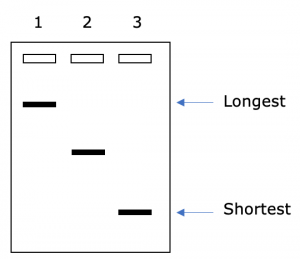
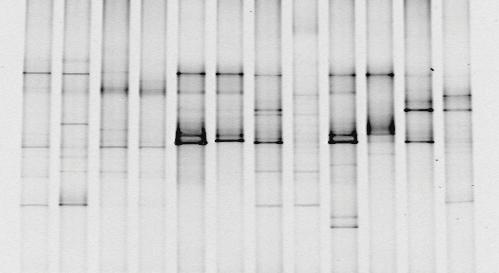
One individual DNA molecule cannot be seen on a gel. However, all of the DNA molecules that are the same size will move the same distance through the gel. They will form a “band” of DNA that can be seen (Figure 4). The intensity or darkness of a band is due to the number of molecules of DNA that are running at that position on the gel. More DNA will cause the band to be darker. Less DNA will cause the band to be lighter.
The size of DNA molecules is usually measured in base pairs (bp). One base pair consists of the nucleotides on the two strands of DNA that are hydrogen bonded together. For example, if there is an A on one strand of the DNA double helix, there would be a T on the second strand. The A and the T together are referred to as one base pair. Larger lengths of DNA can be measured in kb (kilo base pairs; 1000 base pairs).
Restriction Enzymes
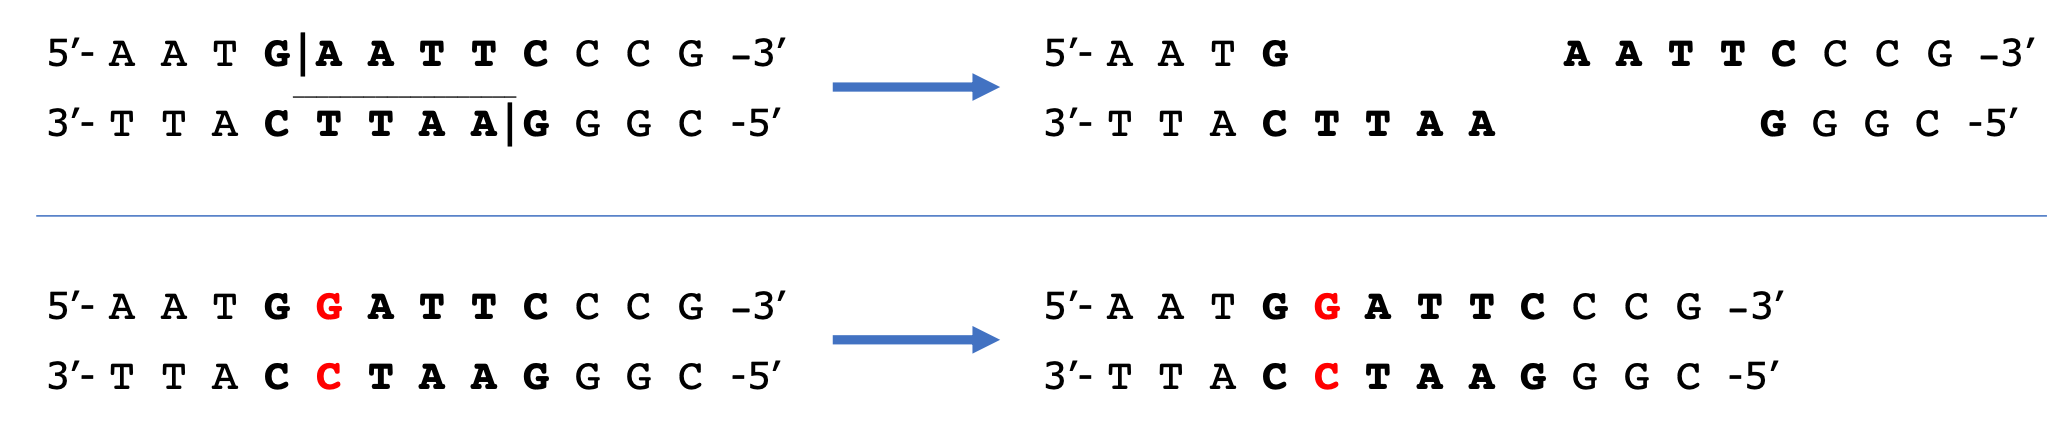
A DNA fingerprint is created by first digesting a DNA sample with a restriction enzyme. Restriction enzymes recognize very specific DNA sequences (such as 5’-GAATTC-3’), which are usually palindromes. Palindromic sequences allow the same sequence to be recognized on both strands of DNA (Figure 5, top). The restriction enzyme will then cut the DNA at a specific point. You can think of restriction enzymes as very specific molecular scissors. In the top DNA sequence seen in Figure 5, the restriction enzyme EcoRI recognizes the sequence GAATTC and cuts between the G and the A on both strands of DNA.
A point mutation (a change in one base in the DNA) can change the site a restriction enzyme recognizes and eliminate the restriction site (Figure 5, bottom). The restriction enzyme will not cut the DNA since its recognition site is no longer present. Alternatively, the point mutation could create a new restriction site where there was not one originally. If the restriction site is present, two short fragments will be produced. In contrast, if the restriction site is absent, one long fragment will remain intact. Other than identical twins, no two individuals will have the same DNA fingerprint. The genomes of any two non-identical individuals will contain a large number of differences in the DNA sequence that have the potential to change restriction sites.
DNA Fingerprinting
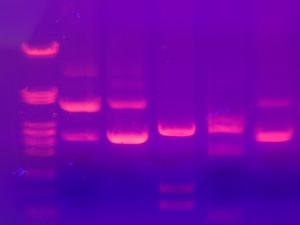
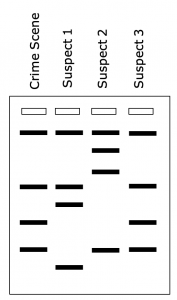
After the DNA has been digested with one or more restriction enzymes, it is separated by size using gel electrophoresis. A radioactive probe is then used to identify certain fragments of DNA that may differ between individuals. By comparing the size of DNA fragments produced by restriction digest, the “DNA fingerprint” of an individual can be generated. A DNA fingerprint would look similar to the gel seen in Figure 6.
DNA fingerprints can be used to identify suspects when a crime has been committed. In this case, the bands in the DNA fingerprint of the culprit would be an exact match to the bands in the DNA fingerprint made from DNA that had been taken from the crime scene (Figure 7).
DNA fingerprinting can also be used to determine paternity. In the case of paternity, the DNA of a child would exactly match the DNA of either of the two parents. In fact, you would expect that only about 50% of the bands in a child would match each parent (remember that meiosis generates haploid gametes that each contain 1 copy of each chromosome). However, all the bands in the child must come from one of the two parents: the child cannot have DNA that does not match with one parent or the other. Therefore, if any bands are not from the mother, they must be from the child’s father. Using this type of analysis, the paternity of an individual can be determined.
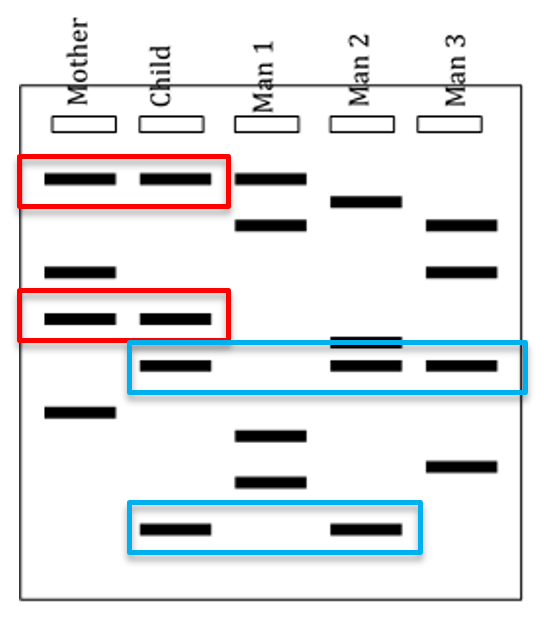
If you look at the DNA fingerprint in Figure 8 above, you will notice that two of the bands match between the mother and the child (red boxes). The remaining two bands in the child must therefore have come from the father. Although Man 1 has one band that matches the child, that band can be accounted for from the mother. Neither of the two bands from the child that did not come from the mother came from Man 1, so Man 1 is eliminated as a potential father. Man 2 and Man 3 both have a band that matches one of the child’s bands (top blue box), but only Man 2 could have given the child both the bands that it did not get from the mother. This means that Man 2 must be the father.
Additionally, DNA fingerprints can be used to determine evolutionary relationships between organisms. Organisms with more similar DNA fingerprints must be more closely related than organisms with more different DNA fingerprints. This is because organisms with more similar DNA fingerprints must have more similar DNA.

.jpg)