
86 Pedigrees and Punnett Squares
Pedigrees
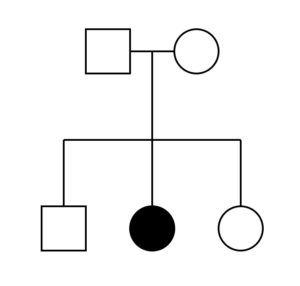
Inheritance of a trait through generations can be shown visually using a pedigree, such as is pictured in Figure 3. Square shapes represent males; circles represent females. Filled-in shapes are individuals that have whatever trait is being shown in the pedigree. Two individuals connected together with a horizontal line between them are the parents of the individuals that are connected by vertical lines below them. Siblings are typically shown in birth order with the oldest sibling to the left.
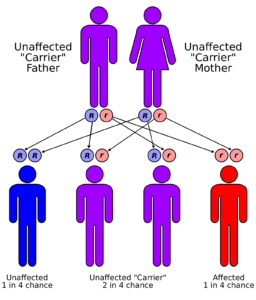
As discussed above, diploid individuals have two copies of each chromosome: one from their male parent, one from their female parent. This means they have two copies of each gene. They can have two of the same alleles (homozygous) or two different alleles (heterozygous). Regardless of their genotype, they will pass one copy of each chromosome to their offspring. This is because meiosis produces haploid gametes that contain one copy of each chromosome. Since genes are present on chromosomes, this means they will pass one copy of each gene to their offspring. That means that an offspring inherits one allele of each gene from each of its two parents. This is illustrated in Figure 4.
An easy, organized way of illustrating the offspring that can result from two specific parents is to use a Punnett square. The gametes that can be generated by each parent are represented above the rows and next to the columns of the square. Each gamete is haploid for the “A gene”, meaning it only contains one copy of that gene. In the Punnett square seen in Figure 5, haploid eggs are above each column and haploid sperm are next to each row. When a haploid sperm and a haploid egg (each with 1 copy of the “A gene”) combine during the process of fertilization, a diploid offspring (with 2 copies of the A gene) is the result.
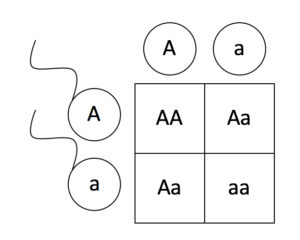
A Punnett square shows the probability of an offspring with a given genotype resulting from a cross. It does not show actual offspring. For example, the Punnett square in Figure 5 shows that there is a 25% chance that a homozygous recessive offspring will result from the cross Aa x Aa. It does not mean that these parents must have 4 offspring and that they will have the ratio 1 AA : 2 Aa : 1 aa. It’s just like flipping a coin: you expect 50% heads, but you wouldn’t be too surprised to see 7 heads out of 10 coin flips. Additionally, the probability does not change for successive offspring. The probability that the first offspring will have the genotype “aa” is 25% and the probability of the second offspring having the genotype “aa” is still 25%. Again, it’s just like flipping a coin: if you flip heads the first time, that doesn’t change the probability of getting heads on the next flip.
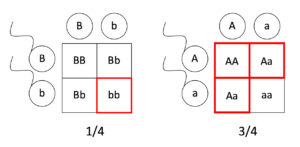
Organisms don’t just inherit one trait at a time, though. They inherit all their traits at once. Sometimes, we want to determine the probability of an individual inheriting two different traits. The easiest way to do this is to determine the probability of the individual inheriting each trait separately, then multiply those probabilities together. An example of this can be seen in Figure 6.
Another way of determining the probability of getting two different traits is to use a dihybrid Punnett square. Figure 7 shows three generations of the inheritance of pea seed color and shape. Peas can be either yellow or green, and they can be either round or wrinkled. These are two of the traits that Mendel studied in his work with peas. In the first generation (the “P” generation), two true-breeding (homozygous) individuals are crossed. Their offspring will get one allele of the Y gene and one allele of the R gene from each parent. This means that all their offspring (the “F1” generation) will be heterozygous for both genes. The results (the “F2” generation) from crossing two heterozygous individuals can be seen in the 4×4 Punnett square in Figure 7.
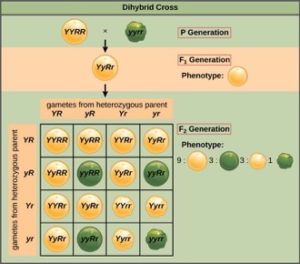
Figure 7: This dihybrid cross shows the expected offspring from the F2 generation after crossing YYRR x yyrr. Compare the results from this Punnett square to the results seen in the previous figure. They match!
The gametes produced by the F1 individuals must have one allele from each of the two genes. For example, a gamete could get an R allele for the seed shape gene and either a Y or a y allele for the seed color gene. It cannot get both an R and an r allele; each gamete can have only one allele per gene. The law of independent assortment states that a gamete into which an r allele is sorted would be equally likely to contain either a Y or a y allele. Thus, there are four equally likely gametes that can be formed when the RrYy heterozygote is self-crossed, as follows: RY, rY, Ry, and ry. Arranging these gametes along the top and left of a 4 × 4 Punnett square (Figure 7) gives us 16 equally likely genotypic combinations. From these genotypes, we find a phenotypic ratio of 9 round–yellow:3 round–green:3 wrinkled–yellow:1 wrinkled–green (Figure 7). These are the offspring ratios we would expect, assuming we performed the crosses with a large enough sample size.
We can look for individuals who have the recessive phenotype for Y and the dominant phenotype for R. These individuals must have two little y’s and at least one big R. The possible genotypes are yyRR or yyRr. Examining the Punnett square in Figure 7, we can find 3 individuals with these genotypes (they are round and green). If you compare the results from Figure 6 and Figure 7, you’ll see that we have arrived at the same value: 3/16!
