The Scientific Process
Biologists study the living world by posing questions about it and seeking science-based responses. This approach is common to other sciences as well and is often referred to as the scientific method. The scientific process was used even in ancient times, but it was first documented by England’s Sir Francis Bacon (1561–1626) (Figure 1), who set up inductive methods for scientific inquiry. The scientific method is not exclusively used by biologists but can be applied to almost anything as a logical problem solving method.

Question
The scientific process typically starts with an observation (often a problem to be solved) that leads to a question. Remember that science is very good at answering questions having to do with observations about the natural world, but is very bad at answering questions having to do with morals, ethics, or personal opinions.
| Questions that can be answered using science | Questions that cannot be answered using science |
| • What is the optimum temperature for the growth of E. coli bacteria? | • How tall is Santa Claus? |
| • Do birds prefer bird feeders of a specific color? | • Do angels exist? |
| • What is the cause of this disease? | • Which is better: classical music or rock and roll? |
| • How effective is this drug in treating this disease? | • What are the ethical implications of human cloning? |
Let’s think about a simple problem that starts with an observation and apply the scientific method to solve the problem. Imagine that one morning when you wake up and flip a the switch to turn on your bedside lamp, the light won’t turn on. That is an observation that also describes a problem: the lights won’t turn on. Of course, you would next ask the question: “Why won’t the light turn on?”
Hypothesis
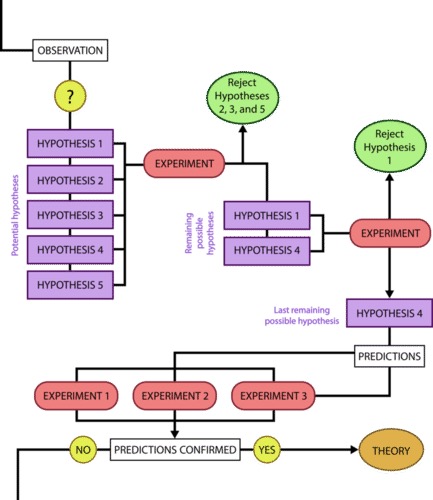
Recall that a hypothesis is a suggested explanation that can be tested. A hypothesis is NOT the question you are trying to answer – it is what you think the answer to the question will be and why. To solve a problem, several hypotheses may be proposed. For example, one hypothesis might be, “The light won’t turn on because the bulb is burned out.” But there could be other answers to the question, and therefore other hypotheses may be proposed. A second hypothesis might be, “The light won’t turn on because the lamp is unplugged” or “The light won’t turn on because the power is out.” A hypothesis should be based on credible background information. A hypothesis is NOT just a guess (not even an educated one), although it can be based on your prior experience (such as in the example where the light won’t turn on). In general, hypotheses in biology should be based on a credible, referenced source of information.
A hypothesis must be testable to ensure that it is valid. For example, a hypothesis that depends on what a dog thinks is not testable, because we can’t tell what a dog thinks. It should also be falsifiable, meaning that it can be disproven by experimental results. An example of an unfalsifiable hypothesis is “Red is a better color than blue.” There is no experiment that might show this statement to be false. To test a hypothesis, a researcher will conduct one or more experiments designed to eliminate one or more of the hypotheses. This is important: a hypothesis can be disproven, or eliminated, but it can never be proven. Science does not deal in proofs like mathematics. If an experiment fails to disprove a hypothesis, then that explanation (the hypothesis) is supported as the answer to the question. However, that doesn’t mean that later on, we won’t find a better explanation or design a better experiment that will be found to falsify the first hypothesis and lead to a better one.
Variables
A variable is any part of the experiment that can vary or change during the experiment. Typically, an experiment only tests one variable and all the other conditions in the experiment are held constant.
- The variable that is tested is known as the independent variable.
- The dependent variable is the thing (or things) that you are measuring as the outcome of your experiment.
- A constant is a condition that is the same between all of the tested groups.
- A confounding variable is a condition that is not held constant that could affect the experimental results.
A hypothesis often has the format “If [I change the independent variable in this way] then [I will observe that the dependent variable does this] because [of some reason].” For example, the first hypothesis might be, “If you change the light bulb, then the light will turn on because the bulb is burned out.” In this experiment, the independent variable (the thing that you are testing) would be changing the light bulb and the dependent variable is whether or not the light turns on. It would be important to hold all the other aspects of the environment constant, for example not messing with the lamp cord or trying to turn the lamp on using a different light switch. If the entire house had lost power during the experiment because a car hit the power pole, that would be a confounding variable.
You may have learned that a hypothesis can be phrased as an “If..then…” statement. Simple hypotheses can be phrased that way (but they must also include a “because”), but more complicated hypotheses may require several sentences. It is also very easy to get confused by trying to put your hypothesis into this format. Hypotheses do not have to be phrased as “if..then..” statements, it is just sometimes a useful format.
Results
The results of your experiment are the data that you collect as the outcome. In the light experiment, your results are either that the light turns on or the light doesn’t turn on. Based on your results, you can make a conclusion. Your conclusion uses the results to answer your original question.

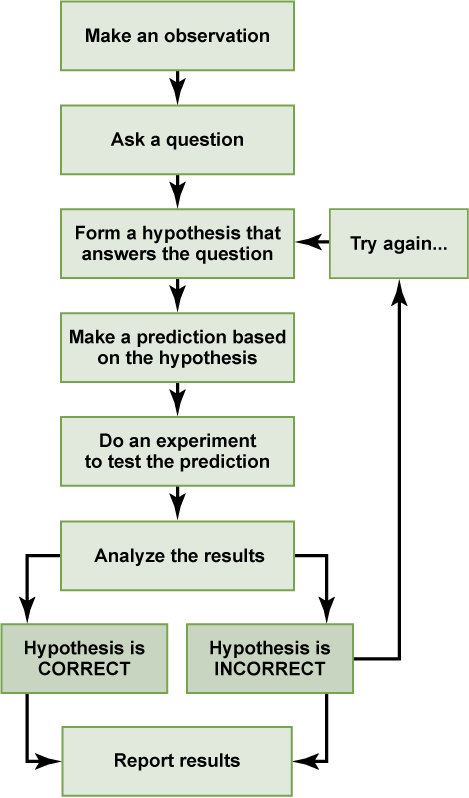
We can put the experiment with the light that won’t go in into the figure above:
- Observation: the light won’t turn on.
- Question: why won’t the light turn on?
- Hypothesis: the lightbulb is burned out.
- Prediction: if I change the lightbulb (independent variable), then the light will turn on (dependent variable).
- Experiment: change the lightbulb while leaving all other variables the same.
- Analyze the results: the light didn’t turn on.
- Conclusion: The lightbulb isn’t burned out. The results do not support the hypothesis, time to develop a new one!
- Hypothesis 2: the lamp is unplugged.
- Prediction 2: if I plug in the lamp, then the light will turn on.
- Experiment: plug in the lamp
- Analyze the results: the light turned on!
- Conclusion: The light wouldn’t turn on because the lamp was unplugged. The results support the hypothesis, it’s time to move on to the next experiment!
In practice, the scientific method is not as rigid and structured as it might at first appear. Sometimes an experiment leads to conclusions that favor a change in approach; often, an experiment brings entirely new scientific questions to the puzzle. Many times, science does not operate in a linear fashion; instead, scientists continually draw inferences and make generalizations, finding patterns as their research proceeds. Scientific reasoning is more complex than the scientific method alone suggests.

Control Groups
Another important aspect of designing an experiment is the presence of one or more control groups. A control group allows you to make a comparison that is important for interpreting your results. Control groups are samples that help you to determine that differences between your experimental groups are due to your treatment rather than a different variable – they eliminate alternate explanations for your results (including experimental error and experimenter bias). They increase reliability, often through the comparison of control measurements and measurements of the experimental groups. Often, the control group is a sample that is not treated with the independent variable, but is otherwise treated the same way as your experimental sample. This type of control group contains every feature of the experimental group except it is not given the manipulation that is hypothesized about (it does not get treated with the independent variable). Therefore, if the results of the experimental group differ from the control group, the difference must be due to the hypothesized manipulation, rather than some outside factor. It is common in complex experiments (such as those published in scientific journals) to have more control groups than experimental groups.
Example 1
Question: Which fertilizer will produce the greatest number of tomatoes when applied to the plants?
Prediction and Hypothesis: If I apply different brands of fertilizer to tomato plants, the most tomatoes will be produced from plants watered with Brand A because Brand A advertises that it produces twice as many tomatoes as other leading brands.
Experiment: Purchase 10 tomato plants of the same type from the same nursery. Pick plants that are similar in size and age. Divide the plants into two groups of 5. Apply Brand A to the first group and Brand B to the second group according to the instructions on the packages. After 10 weeks, count the number of tomatoes on each plant.
Independent Variable: Brand of fertilizer.
Dependent Variable: Number of tomatoes.
The number of tomatoes produced depends on the brand of fertilizer applied to the plants.
Constants: amount of water, type of soil, size of pot, amount of light, type of tomato plant, length of time plants were grown.
Confounding variables: any of the above that are not held constant, plant health, diseases present in the soil or plant before it was purchased.
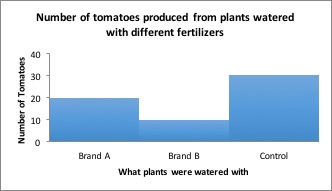
Results: Tomatoes fertilized with Brand A produced an average of 20 tomatoes per plant, while tomatoes fertilized with Brand B produced an average of 10 tomatoes per plant.
You’d want to use Brand A next time you grow tomatoes, right? But what if I told you that plants grown without fertilizer produced an average of 30 tomatoes per plant! Now what will you use on your tomatoes?

Results including control group: Tomatoes which received no fertilizer produced more tomatoes than either brand of fertilizer.
Conclusion: Although Brand A fertilizer produced more tomatoes than Brand B, neither fertilizer should be used because plants grown without fertilizer produced the most tomatoes!
Positive control groups are often used to show that the experiment is valid and that everything has worked correctly. You can think of a positive control group as being a group where you should be able to observe the thing that you are measuring (“the thing” should happen). The conditions in a positive control group should guarantee a positive result. If the positive control group doesn’t work, there may be something wrong with the experimental procedure.
Negative control groups are used to show whether a treatment had any effect. If your treated sample is the same as your negative control group, your treatment had no effect. You can also think of a negative control group as being a group where you should NOT be able to observe the thing that you are measuring (“the thing” shouldn’t happen), or where you should not observe any change in the thing that you are measuring (there is no difference between the treated and control group). The conditions in a negative control group should guarantee a negative result. A placebo group is an example of a negative control group.
As a general rule, you need a positive control to validate a negative result, and a negative control to validate a positive result.
- You read an article in the NY Times that says some spinach is contaminated with Salmonella. You want to test the spinach you have at home in your fridge, so you wet a sterile swab and wipe it on the spinach, then wipe the swab on a nutrient plate (petri plate).
-
- You observe growth. Does this mean that your spinach is really contaminated? Consider an alternate explanation for growth: the swab, the water, or the plate is contaminated with bacteria. You could use a negative control to determine which explanation is true. If a swab is wet and wiped on a nutrient plate, do bacteria grow?
- You don’t observe growth. Does this mean that your spinach is really safe? Consider an alternate explanation for no growth: Salmonella isn’t able to grow on the type of nutrient you used in your plates. You could use a positive control to determine which explanation is true. If you wipe a known sample of Salmonella bacteria on the plate, do bacteria grow?
- In a drug trial, one group of subjects are given a new drug, while a second group is given a placebo drug (a sugar pill; something which appears like the drug, but doesn’t contain the active ingredient). Reduction in disease symptoms are measured. The second group receiving the placebo is a negative control group. You might expect a reduction in disease symptoms purely because the person knows they are taking a drug so they should be getting better. If the group treated with the real drug does not show more a reduction in disease symptoms than the placebo group, the drug doesn’t really work. The placebo group sets a baseline against which the experimental group (treated with the drug) can be compared. A positive control group is not required for this experiment.
- In an experiment measuring the preference of birds for various types of food, a negative control group would be a “placebo feeder”. This would be the same type of feeder, but with no food in it. Birds might visit a feeder just because they are interested in it; an empty feeder would give a baseline level for bird visits. A positive control group might be a food that squirrels are known to like. This would be useful because if no squirrels visited any of the feeders, you couldn’t tell if this was because there were no squirrels around or because they didn’t like any of your food offerings!
- To test the effect of pH on the function of an enzyme, you would want a positive control group where you knew the enzyme would function (pH not changed) and a negative control group where you knew the enzyme would not function (no enzyme added). You need the positive control group so you know your enzyme is working: if you didn’t see a reaction in any of the tubes with the pH adjusted, you wouldn’t know if it was because the enzyme wasn’t working at all or because the enzyme just didn’t work at any of your tested pH. You need the negative control group so you can ensure that there is no reaction taking place in the absence of enzyme: if the reaction proceeds without the enzyme, your results are meaningless.
References
Text adapted from: OpenStax, Biology. OpenStax CNX. May 27, 2016 http://cnx.org/contents/s8Hh0oOc@9.10:RD6ERYiU@5/The-Process-of-Science.

