
Chapter 8: Tonal Scale
8.3 Exercise 3: Adjusting the histogram in Levels or Curves
For this exercise we will complete the first step (Levels) on the grayscale image that was used in Exercise 2, ch8-lastname-flower_gray.psd. Then we will use the color version of the file, ch8-lastname-flower_cropped.psd, again.
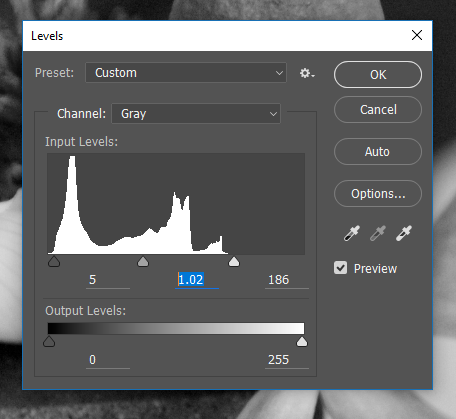
- Click Image > Adjustments > Levels, which is used to control tonal adjustments specifically in the shadow and highlight areas. The Levels dialog box displays the histogram that we just viewed in the previous exercise. At the left side, tonal information is presented for shadow areas, then mid-tones, followed by highlights on the right side. Moving the input level sliders (the small triangles just beneath the graph) to correspond to image areas where there is information on the left and right sides of the histogram readjusts where 100% black and 100% white occur within the image. Tonal manipulations occur as a result of adjusting the numbers associated with each slider. If the objective is to make the image look abstract through high contrast, move the sliders towards each other. If the objective is to make the image seem true to life, the sliders should be used carefully. Adjust the sliders to your taste and click OK.
 Use File > Save As and save a copy of this adjusted image as ch8-lastname-flower_gray_adjusted.psd
 - Open your ch8-lastname-flower_cropped.psd image. We’ll be making some adjustments to the image so use File> Save As and save a copy named ch8-lastname-flower_curves.psd – this will be your working file for the remainder of this exercise. Look at the Histogram panel to see information about the grayscale values in this image.
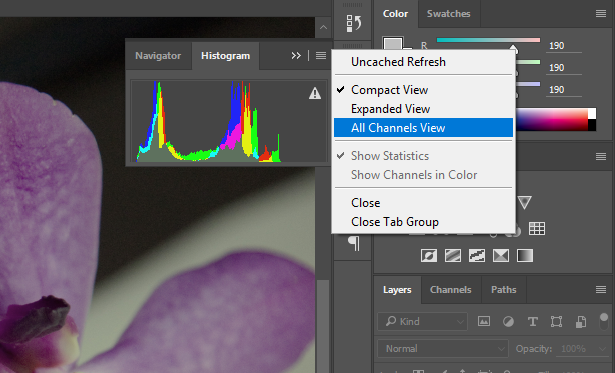
- From the upper right pull-down menu in the Histogram panel, choose “All Channels View” to see the histogram for the composite RGB channel as well as the single red, green and blue channels that comprise the image. Even though the image is seen in color, the overall scale of gray values should be evaluated. Notice the graphs in the Histogram panel for each of the three separate channels (ask yourself the same questions as we posed when evaluating a grayscale image in exercise two).
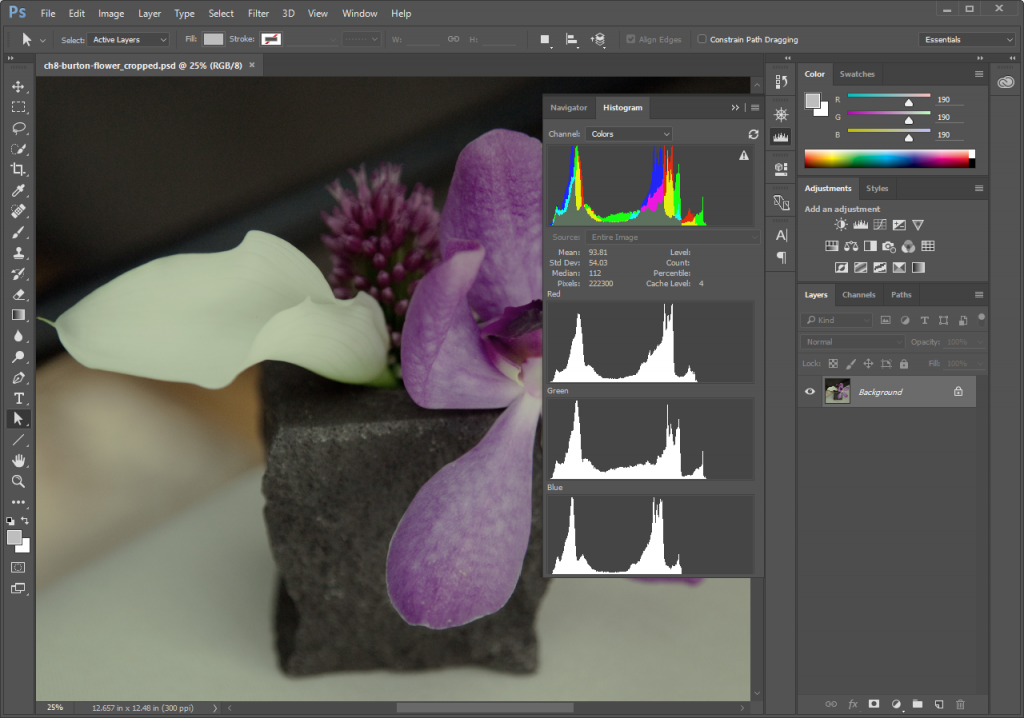
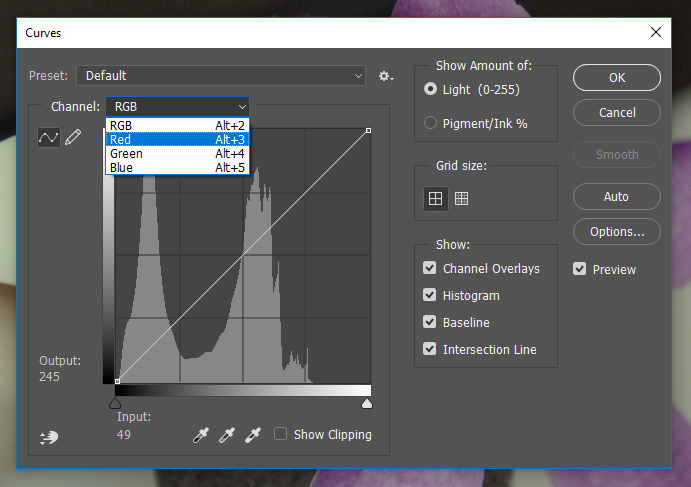
Look at the individual histograms for the red, green, and blue channels. Notice that there is more highlight information in the red channel, while all three channels peak around the same point in the shadow areas. Also notice that the red channel has the most color information across the x-axis while the other two channels have steeper slopes towards the start and ending points of the curves. - Click Image > Adjustments > Curves. Once again, the histogram is presented in the Curves dialog box. Curves, like Levels, can be used to adjust the tonal scale within the image.
- This time, don’t touch the RGB composite histogram. Instead, adjust each of the red, green, and blue graphs individually so that there is image information where the deepest shadows and lightest highlights appear. To do this, start by using the pull-down Channel menu from within the Curves dialog box to select “Red” (or use Alt/Option+3 on your keyboard). Use the input sliders on the left and right sides to move the edges of the endpoints of the line graph to the point where image information exists.

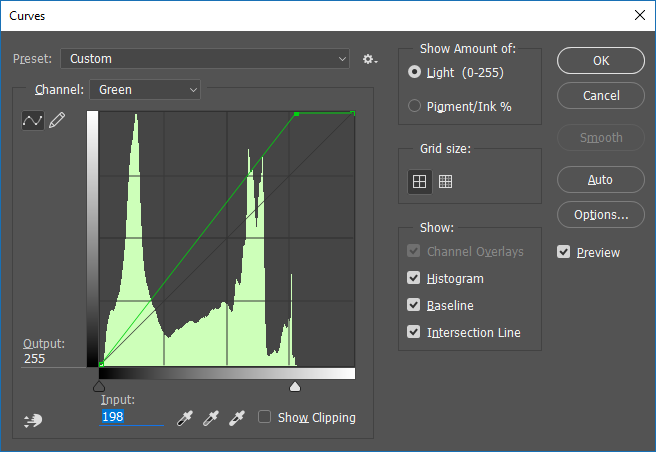
- Use the Channel pull-down menu to select “Green” (Alt/Option+4). Use the input sliders on the left and right sides to move the edges of the endpoints of the line graph to the point where image information exists.
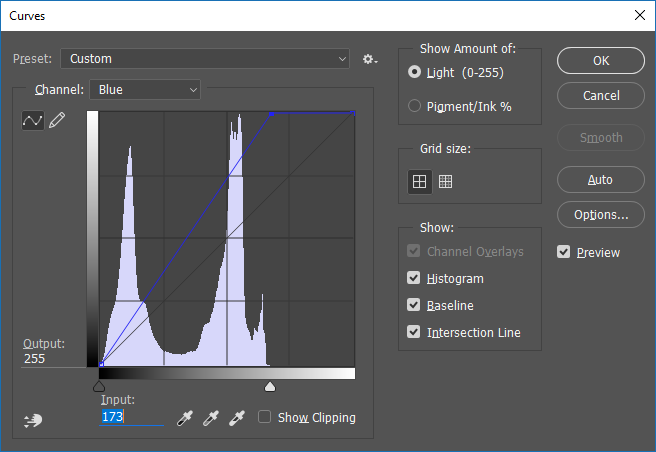
- Use the Channel pull-down menu to select “Blue” (Alt/Option+5). Use the input sliders on the left and right sides to move the edges of the endpoints of the line graph to the point where image information exists.
- Click OK. Adjusting the Curves (or Levels, either adjustment could have been used for this last exercise) manually for each color channel produces a better result than simply doing this one time for the composite RGB channel.
- Notice the Histogram. It should show a graph with information that spans from the left side of the x-axis (shadows) to the right side (highlights).
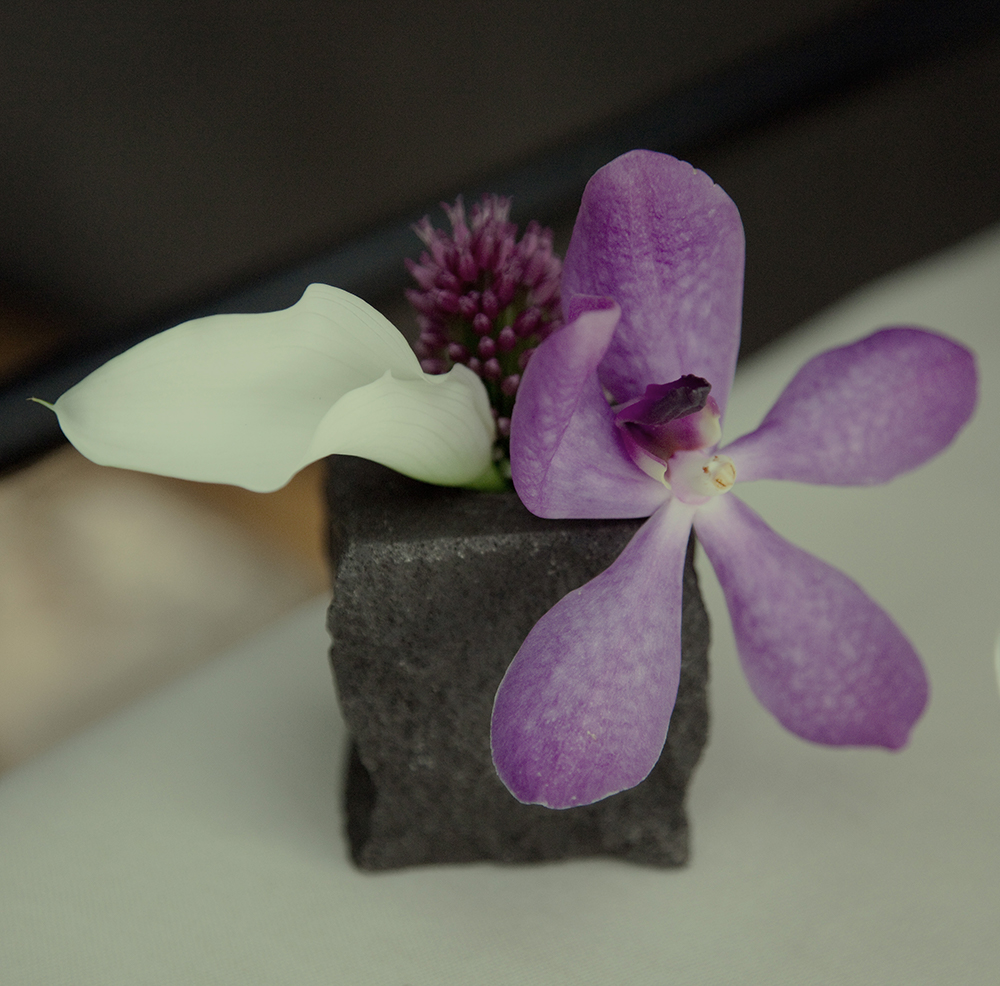
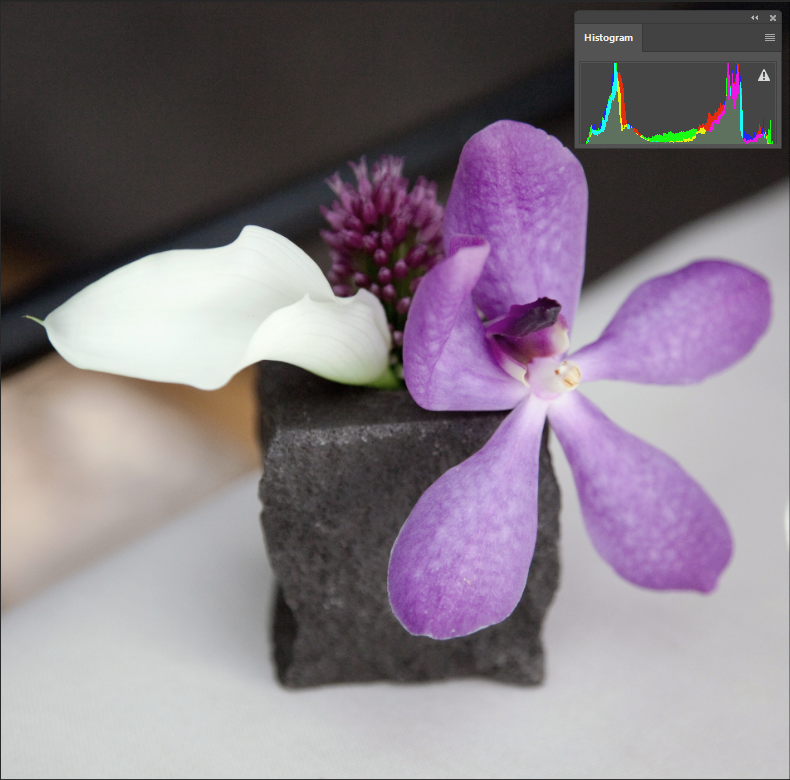 The image on the top is before the curves were altered and the image on the bottom has been modified. Information spans the entire x-axis on the histogram. Notice that the contrast is slightly modified, but the overall change to the image is slight. Be careful about pushing the sliders too far. The modifications should be minimal.

