
53 Deformation of Tissues
Stress vs. Strain Curves
If you apply some stress to a material and measure the resulting strain, or vice versa, you can create a stress vs. strain curve like the one shown below for a typical metal.
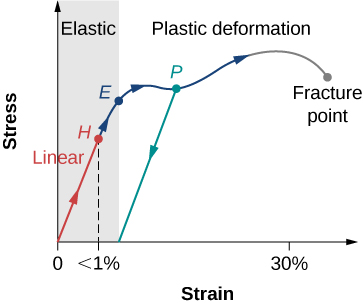
We see that the metal starts off with stress being proportional to strain, which means that the material is operating in its linear region. We have graphed stress on the vertical axis and strain on the horizontal axis, so the value of stress/strain is equal to the rise/run of the graph. We saw in the previous chapter that within the linear region stress/strain is equal to the the elastic modulus and we know the rise/run of a graph is the slope, therefore the elastic modulus of a material is equal to the slope of the linear portion its stress vs. curve. Let’s discuss the important features of the stress vs. strain curve:
- The absolute highest point on the graph is the ultimate strength, indicating the onset of failure toward fracture or rupture.
- Notice that after reaching the ultimate strength, but before full failure, the stress can actually decrease as strain increases, this is because the material is changing shape by breaking rather than stretching or compressing the distance between molecules in the material.
- In the first part of the elastic region, the strain is proportional to the stress, this is known as the linear region. The slope of this region is the elastic modulus.
- After the stress reaches the linearity limit (H) the slope is no longer constant, but the material still behaves elastically.
- The elastic region ends and the plastic region begins at the yield point (E). In the plastic region, a little more stress causes a lot more strain because the material is changing shape at the molecular level. In some cases the stress can actually decrease as strain increases, because the material is changing shape by re-configuring molecules rather than just stretching or compressing the distance between molecules.
- The green line originating at P illustrates the metal’s return to non-zero strain value when the stress is removed after being stressed into the plastic region (permanent deformation).
Stress and Strain in Tendons
Tendons (attaching muscle to bone) and ligaments (attaching bone to bone) have somewhat unique behavior under stress. Functionally, tendons and ligaments must stretch easily at first to allow for flexibility, corresponding to the toe region of the stress-train curve shown below, but then resist significant stretching under large stress to prevent hyper-extension and dislocation injuries, corresponding to the linear region.
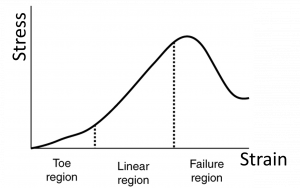
The structure of the tendon creates this specialized behavior. To create the toe region, a small stress causes the fibers in the tendon begin to align in the direction of the stress, or uncrimp, and the re-alignment provides additional length. Then in the linear region, the fibrils themselves will be stretched.
Stress and Strain Injuries
Stress beyond the yield point of a material will cause permanent deformation and the region of the stress vs. strain curve beyond the yield point is called the failure region. Stress above the ultimate strength will cause fracture or rupture. These occurrences in body tissues are known as injuries. For example, sprains occur when a ligament (connects bone to bone) is torn by a stress greater than its ultimate strength or just stretched into its failure region. The same event occurring in a tendon (connects muscle to bone) is called known as strain.[3] We already know that strain has a different, but related meaning to physicists and engineers, so that discrepancy in terminology is something to watch out for.
Reinforcement Activity
- OpenStax University Physics, University Physics Volume 1. OpenStax CNX. Aug 2, 2018 http://cnx.org/contents/d50f6e32-0fda-46ef-a362-9bd36ca7c97d@11.1. ↵
- OpenStax, College Physics. OpenStax CNX. Aug 6, 2018 http://cnx.org/contents/031da8d3-b525-429c-80cf-6c8ed997733a@13.1. ↵
- "Sprains and Strains" by Patient Care and Health Information, Mayo Clinic ↵
a physical quantity that expresses the internal forces that neighboring particles of material exert on each other
the measure of the relative deformation of the material
region of the stress vs. strain curve for which stress is proportional to strain and the material follows Hooke's Law
measures of resistance to being deformed elastically under applied stress, defined as the slope of the stress vs. strain curve in the elastic region
the maximum stress a material can withstand
the separation of an object or material into two or more pieces under the action of stress and associated strain
the sudden and complete failure of a material under stress
the range of values for stress and strain values over which a material returns to its original shape after deformation
the range of values for stress and strain over which a material experiences permanent deformation
the value of the stress (yield stress) and strain (yield strain) beyond which a material will maintain some permanent deformation
range of values for stress and strain over which a material experiences large strain for relatively small stress due to un-crimping
non-permanent re-alignment of substructures (fibers) in a material that results in non-linear behavior at stress values less than the yield stress.
Region of the stress vs. strain curve beyond the yield point, where permanent deformation occurs.
