
26 Unit 3 Practice and Assessment
Outcomes 1, 2, 3
- Would putting larger tires on a vehicle introduce random or systematic error into the speedometer reading? Would this affect the accuracy or precision (or both) of the speedometer? Explain your answers.
- Would a wiggling baby introduce random or systematic error into a measurement of its weight? Would this affect the accuracy or precision (or both) of the weight measurement? Explain your answers.
- Would slightly under-filling measuring cups to prevent spilling ingredients introduce random or systematic error into the measurement of ingredient volumes? Would this affect the accuracy or precision (or both) of the measurement volumes. Explain your answers.
A set of measurements of a physical quantity was made for comparison to an accepted standard value. The data were plotted in graphs with the measured values on the horizontal axis and the number of times each value occurred on the vertical axis. This type of graph is known as a histogram and the data on the vertical axis are called the frequencies. Use the histograms below to answer the questions that follow.
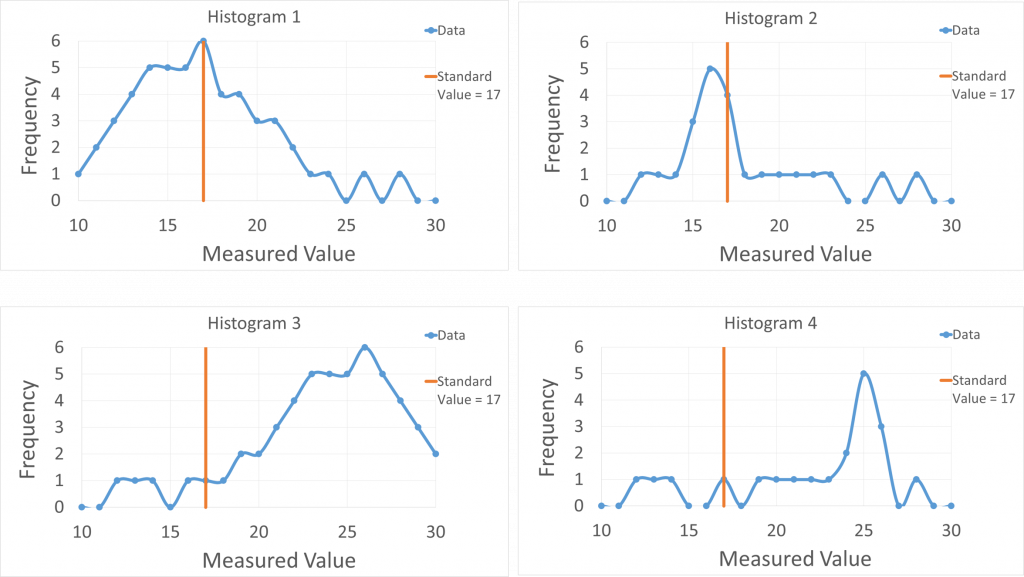
- For each histogram state whether the data suggest the measurements were relatively accurate, precise, both, or neither. Explain your reasoning.
- For each histogram state what types of errors were likely to be relatively significant: random, systematic, both or neither. Explain your reasoning.
Outcome 4
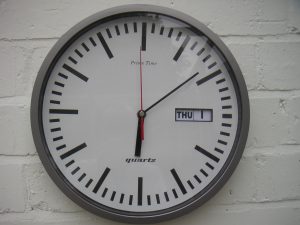
6)A person measures his or her heart rate by counting the number of beats in 30 s as timed using a clock on the wall, such as the one in the image below. They start counting when the second hand jumps onto a particular tick mark (say the 12) and then stop counting when it jumps to the opposite mark (say the 6). A reasonable estimate of the uncertainty in the time measurement would be which of the values listed below? Explain your reasoning.
a) 0.05 s
b) 0.5 s
c) 5 s
d) 50 s
- Estimate the uncertainty in counting the beats in the previous problem. Explain your reasoning.
*8) If 47 beats were counted by the person in the previous problem, what a was their heart rate in BPM in correct significant figures. Indicate the total % uncertainty and total uncertainty.
- Clock By Lee Haywood from Wollaton, Nottingham, England (Clock) [CC BY-SA 2.0 (https://creativecommons.org/licenses/by-sa/2.0)], via Wikimedia Commons ↵
A graph of relating how often a value falls within a certain range.
Amount by which a measured, calculated, or approximated value could be different from the actual value
