
95 Thermal Radiation Spectra
The Electromagnetic Spectrum
Different names are used for electromagnetic radiation (light waves) with various ranges of frequency: radio waves, microwaves, infrared radiation, visible light, ultraviolet radiation, X-rays, and gamma rays. Collectively these ranges of frequencies make up the electromagnetic spectrum shown in the following diagram. The range frequencies that we can see is known as the visible spectrum, and we perceive the different frequencies within the visible spectrum as different colors. The wavelength of light, or any wave, is the distance between successive crests (peaks) of the wave. The frequency and wavelength of light waves are directly related and we can sometimes more easily relate to wavelength by comparing it to the length of familiar objects, so we often use wavelength instead of frequency to describe colors and the electromagnetic spectrum as a whole.

We can summarize the previous diagram in tabular form:
| Radiation Type | Wavelength (m) | Approximate Wavelength Scale | Frequency (Hz) | Temperature of object with thermal radiation peak at this wavelength (K) | Significant penetration through atmosphere ? |
| Gamma Ray | 10-12 | Atomic Nucli | 1020 | No | |
| X-ray | 10-10 | Atoms | 1018 | 10,000,000 | No |
| Ultraviolet (UV) | 10-8 | Molecules | 1016 | No (more at longer wavelength) | |
| Visible | 0.5-6 | Protozoans | 1015 | 10,000 | Yes |
| Infrared (IR) | 10-5 | Needle Point | 1012 | 100 | Yes (less at longer wavelength) |
| Microwave | 10-2 | Butterflies | 108 | 1 | No |
| Radio | 103 | Humans to Buildings | 104 | Yes (less at shorter wavelength) |
Black Body Radiation
A theoretically perfect emitter for which the emissivity is one ( ) is known as black body emitter, because such an emitter would also be a perfect absorber and would thus appear completely black. The shape amount of light emitted at each wavelength defines the emission spectrum of the black body, which depends only on temperature in a well-defined way:
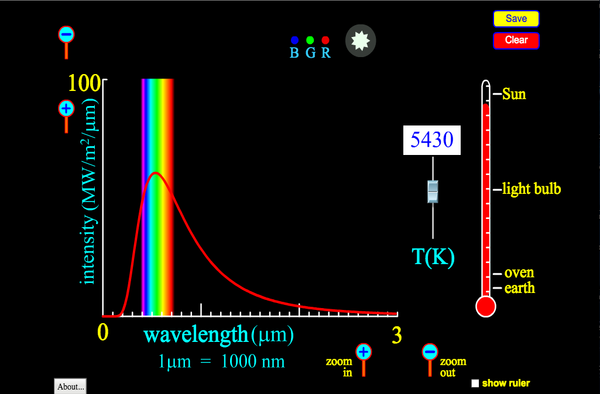
This simulations allows you to see how the black body emission spectrum depends on temperature:
Exercises
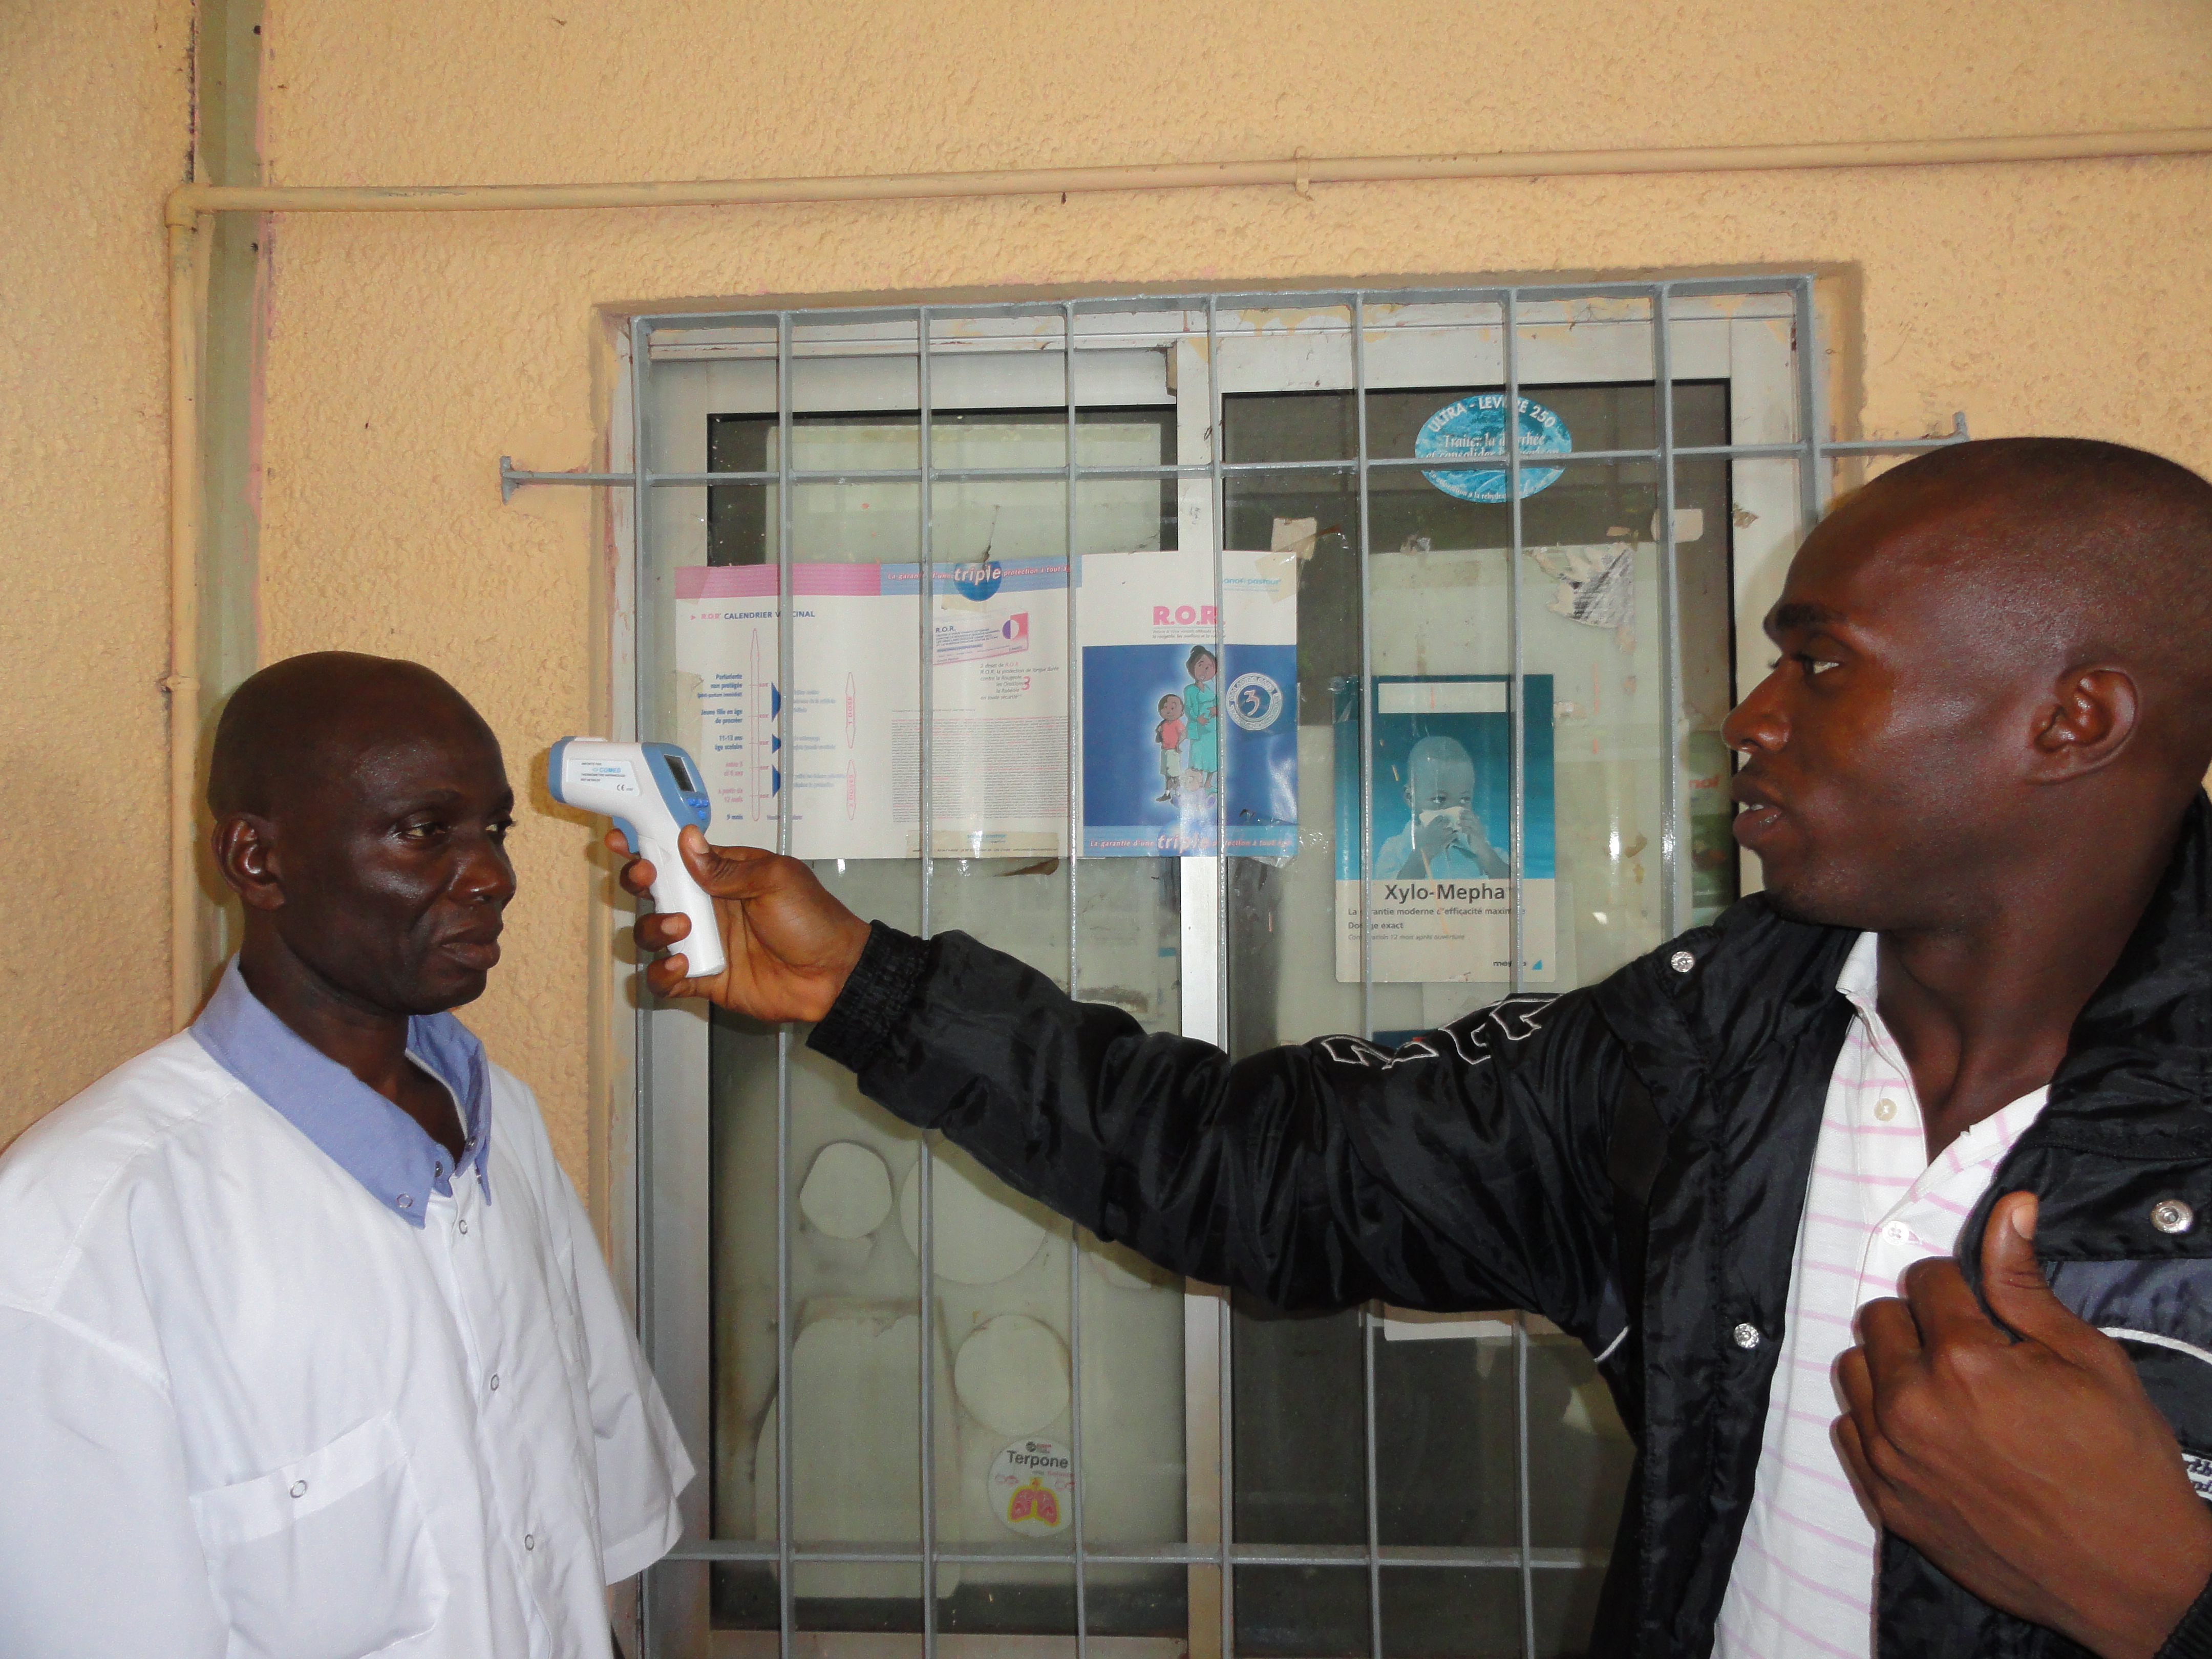
We are often able to approximate the temperature of objects by assuming they are black body emitters and matching up their emission spectrum with that of a black body with a known temperature. This is the basic principle behind thermal imaging cameras and handheld infrared (IR) thermometers such as the one in the following image. (Note that IR thermometers are often include a low power laser to improve aim, but contrary to popular belief, the laser is not involved in the temperature measurement).
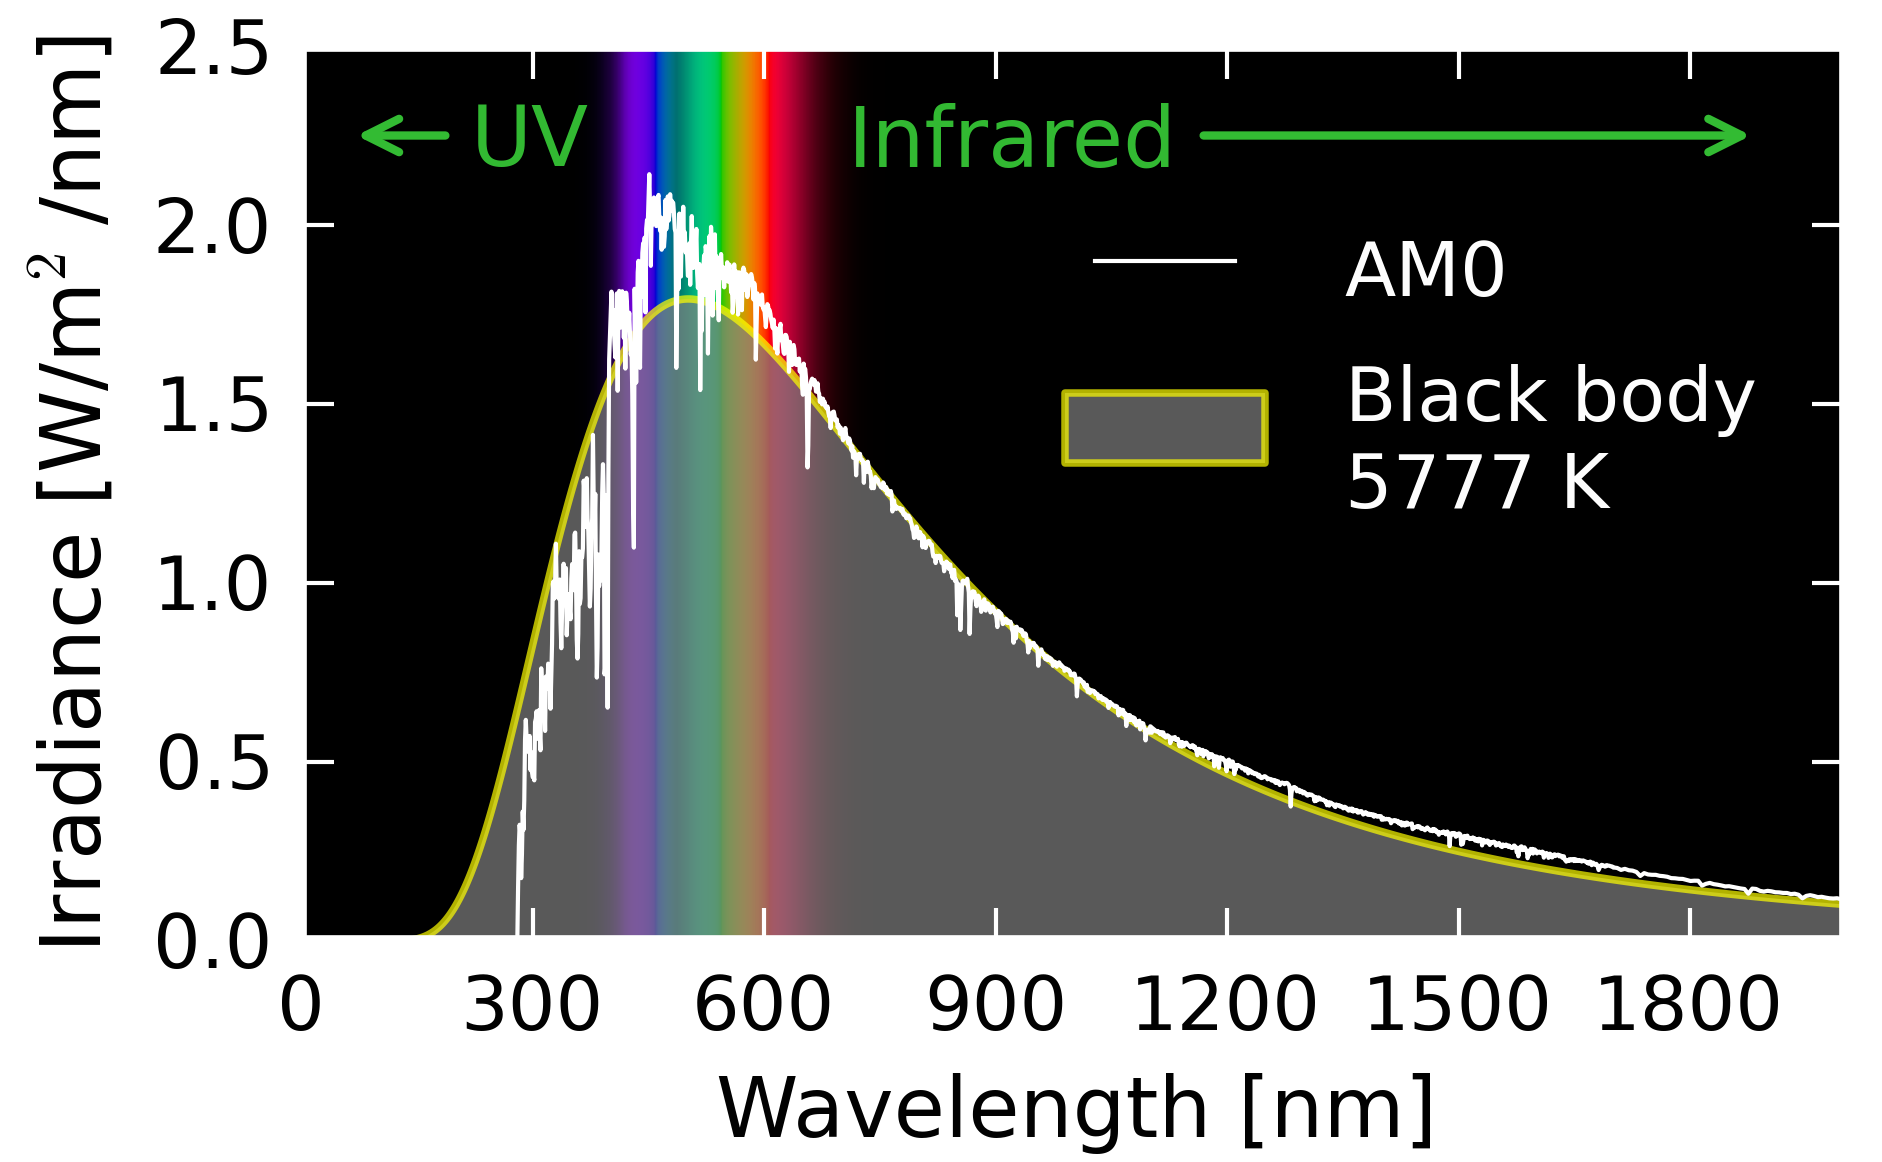
For example, we can estimate the surface temperature of the sun to be roughly 6000 K (10,000 °F) because the actual emission spectrum of the Sun best matches the black body emission spectrum of an object at 6000 K, as seen in the following graph. Notice that the peak of the Sun’s emission spectrum is in the visible range, but that significant radiation power is found in the UV and IR regions. The UV light is capable of penetrating the dead out layer of skin (epidermis) and breaking some molecular bonds in your cells, including those in DNA, which can lead to sunburn and increased risk of skin cancer.
Everyday Example: Incandescent vs LED and Fluorescent Light Bulbs
Incandescent light bulbs use thermal radiation to generate light. In order for their emission spectrum to contain significant visible light their temperature must be several thousand Kelvin, as seen from the previous graph showing black body emission spectra at several temperatures. Temperatures of 3000 K to 4000 K are achieved by running electric current through the narrow filaments of inside the bulbs to cause resistive heating (conversion of electric potential energy to thermal energy). The filaments are made of high temperature tolerant metals like tungsten to prevent melting. Additionally, the majority of air within the bulb has been removed to prevent conduction and natural convection from heating the glass and to prevent the filaments from quickly oxidizing (rusting). The emission spectra for objects at 3000 K to 4000 K show us that much of their radiated power is in the IR range rather than the visible range, and thus doesn’t provide useful illumination. Consequently, much of the electrical energy used to power incandescent light bulbs goes to waste. In fact, glass does absorb IR radiation so much of the wasted energy simply goes into making the bulb glass hot, in some cases dangerously so. Fluorescent and LED bulbs don’t use thermal radiation to generate light. Instead they apply voltages to energize electric charges trapped in atoms or in semi-conductor materials. When the electrons de-energize they emitted light at specific wavelengths, reducing the wasteful production of non-visible light. However, light from incandescent bulbs is sometimes considered more pleasing because it more closely resembles the emission spectrum of fire.
Dangerously Hot Cars
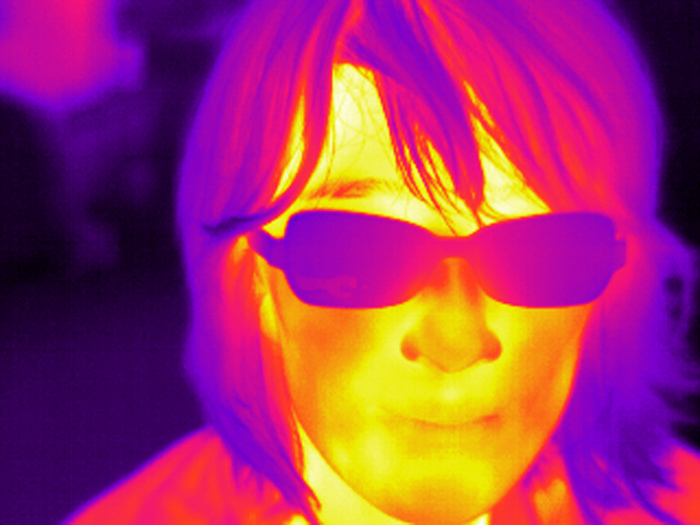
Some materials are transparent to visible light, but readily absorb IR light (notice how glasses prevent IR light from reaching the camera in this thermal image). Liquid water, water vapor, carbon dioxide (CO2) gas and most types of glass behave this way. The emission spectrum of the sun shown above has significant emission in the UV, visible, and IR parts of the electromagnetic spectrum. The visible light gets through the glass, which is why the glass appears transparent to you. The majority of UV is absorbed or reflected, preventing you from getting sunburn inside the car. The glass absorbs much of the IR light, which is re-radiated in both directions, in and out of the car. The visible light that gets through is partially absorbed by the interior of the car (especially if the interior is dark). That absorbed visible light is then re-radiated as IR light because the interior of the car is not nearly hot to enough to radiate visible light like the sun. That re-radiated IR light is absorbed by the glass and re-radiated again in both directions, in and out of the car. Therefore a significant portion of the incoming visible light energy gets trapped inside the car and the interior temperature can rise quickly, even if the outside air temperature is cool. Green houses use this same phenomenon to keep plants warm in cool weather, so this phenomenon is commonly known as the green house effect. It’s never a good idea to leave children or pets in cars. Even if you perform thoughtful calculations to predict the interior temperature for a given set of conditions such as air temperature, wind speed, and cloudiness, those conditions can change quickly. It’s best not to risk injury to loved ones.
The Greenhouse Gas Effect
The Earth’s atmosphere acts like a car’s windshield. The atmosphere lets most UV and visible light through, but significant IR light is absorbed, primarily by water vapor and carbon dioxide gas. With respect to the Earth, this green-house effect is known as the Green House Gas Effect because the phenomenon is caused by gasses in the atmosphere instead of glass or plastic.

The green house gas effect helps to keep the Earth’s temperature about 40 °C warmer than it would be without an atmosphere, which is a generally a good thing for us because most water on Earth would be frozen otherwise. Humans have established our modern infrastructure in accordance with the global climate that was present over the last few hundred years, but emission of carbon dioxide and methane (and other greenhouse gases) into Earth’s atmosphere from human activities strengthens the green house gas effect and increases the average temperature of the Earth. Higher temperature means more thermal energy is available to drive more powerful convection cells and other thermodynamic processes that define weather and climate. The resulting changes in global climate are likely to cause a variety of dangerous and expensive consequences such as higher storm intensity, rising sea levels, and increased flooding in certain areas with prolonged drought in others.[5][6]
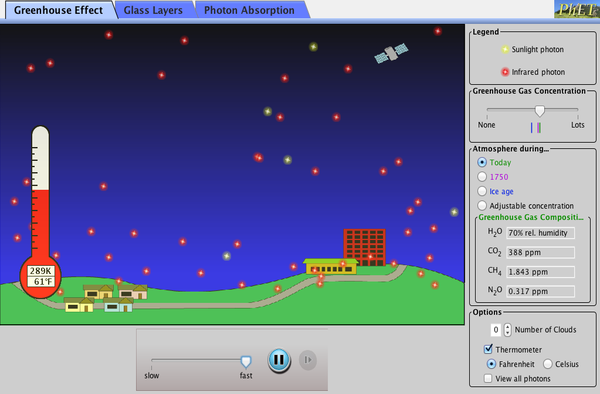
The following simulation allows you to examine how the green house gas effect works.
- "EM Spectrum Properties reflected" by Inductiveload [CC BY-SA 3.0 (https://creativecommons.org/licenses/by-sa/3.0)], via Wikimedia Commons ↵
- OpenStax University Physics, University Physics Volume 3. OpenStax CNX. Nov 12, 2018 http://cnx.org/contents/af275420-6050-4707-995c-57b9cc13c358@10.14. ↵
- Infrared thermometer training by CDC Global [CC BY 2.0 (https://creativecommons.org/licenses/by/2.0)], via Wikimedia Commons ↵
- OpenStax University Physics, University Physics. OpenStax CNX. Oct 6, 2016 http://cnx.org/contents/74fd2873-157d-4392-bf01-2fccab830f2c@1.585 ↵
- "Fourth National Climate Assessment" by U.S. Global Change Research Program ↵
- OpenStax University Physics, University Physics. OpenStax CNX. Oct 6, 2016 http://cnx.org/contents/74fd2873-157d-4392-bf01-2fccab830f2c@1.585 ↵
light waves, or coupled oscillating electric and magnetic fields fields that can travel through empty space and carry both energy and momentum without moving mass
the number of cycles or oscillations occurring per second, as in the frequency of the electromagnetic oscillations in a light wave
having a frequency just lower than visible red light but higher microwaves.
the range of wavelengths or frequencies over which electromagnetic radiation extends
the portion of the electromagnetic spectrum that is visible to the human eye
the distance between successive crests of a wave, such as a sound wave or electromagnetic wave
measure of a material's effectiveness at emitting energy as thermal radiation
an ideal object which absorbs all radiation that strikes it, with no reflection, and releases that energy as thermal radiation in a way that depends only on its temperature
data which describes the relative amount of electromagnetic radiation emitted by an object across a range of wavelengths, or conversely frequencies.
a measure of the average kinetic energy of the particles (e.g., atoms and molecules) in an object, which determines how relatively hot or cold an object feels
image created by substituting visible color variations for temperature variations determined by measuring variations in thermal radiation intensity and/or wavelengths
a device that measures temperature
the rate at which work is done, the rate at which energy is converted from one form to another
Electromagnetic radiation spontaneously emitted by all objects with temperature above absolute zero.
SI unit of temperature
the energy stored within an object, due to the object's position, arrangement or state. Examples are gravitational potential energy due to the relative position of masses and elastic potential energy caused by being under stress
energy stored in the microscopic motion of atoms and molecules (microscopic kinetic energy)
changing phase from solid to liquid.
the process by which heat or directly transmitted through a substance when there is a difference of temperature between adjoining regions, without movement of the material
Transfer of heat due to fluid movement caused by thermal expansion of the fluid
allow light to pass through with minimal absorption
Elevation of Earth's temperature relative to the atmosphere-free condition caused differential absorption of UV, visible, and IR light by specific gases and particles present in the atmosphere.
cyclic fluid flow caused by natural convection

.png)