104 Lab 6: Modeling Tendon Elasticity (Distance Learning Compatible)
Modeling Tendon Elasticity
Materials:
- writing utensil
- calculator
- digital device with spreadsheet program
- digital device with internet access
Observation
Elastic materials that we use every day, such as hair ties (see image below), appear to stretch easily up to a certain point, but then become very stiff and difficult to stretch. This appears similar to the behavior of tendons, which have crimping behavior that produces a toe region in the stress-strain curve.
Questions
Are hair ties goods models for tendons?
Search Existing Knowledge
1) Can you find any existing information that helps to answer our question? Explain below, and cite your sources.
Hypothesis Generation:
2) We need to turn our question into a set of testable statements such that the results of testing the statements will provide evidence that helps us to answer the question.
- If hair-ties provide a reasonable model of tendon crimping behavior, then their stress vs. strain curve will have a __________ region and a linear region.
- If hair-ties provide a reasonable model of tendon failure behavior, then their stress vs. strain curve will have a visible curved ____________region between the linear region and the rupture point.
- If hair-ties provide a reasonable model of tendon strength, then their __________ modulus and ____________ strength will be similar to that of tendons.
Experimental Hypothesis Testing
Data Collection
To test your hypotheses you will create a stress-strain curve for the hair tie. The materials tester in the video provides the tension force and the displacement (stretch). That data is available in an online spreadsheet. You can copy and paste the data into your own spreadsheet for analysis.
Data Analysis
Stress and Strain
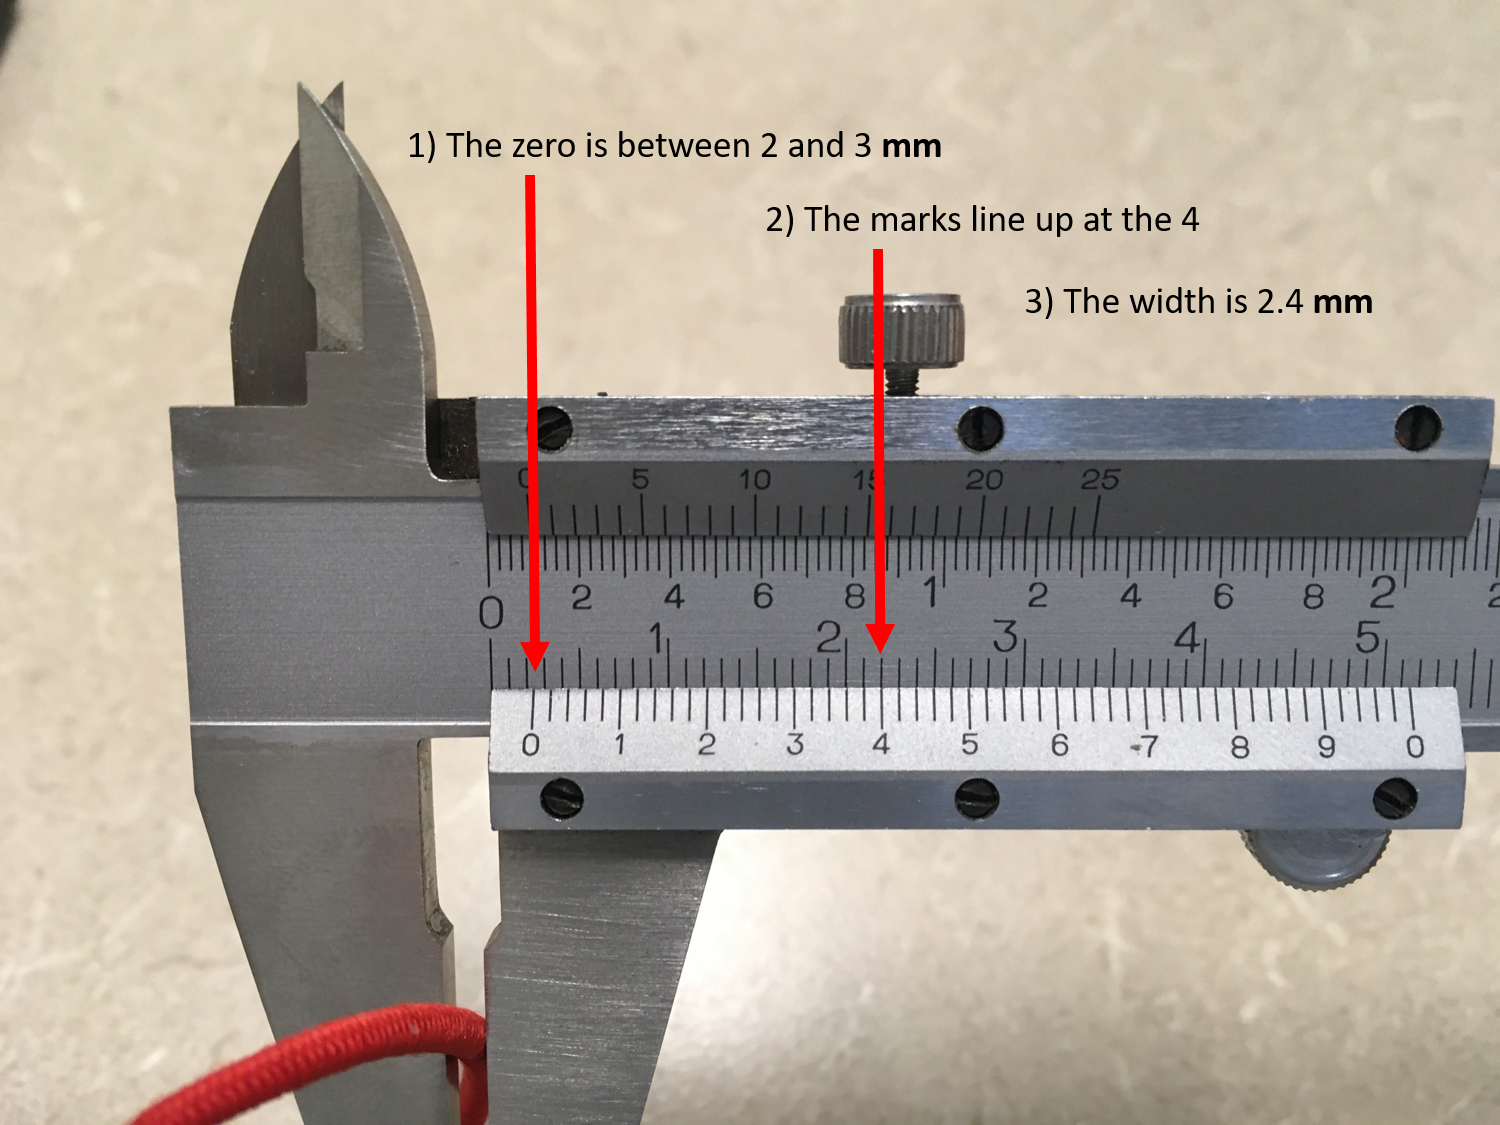
To calculate stress from the force data we will need to know the cross-sectional area of the rubber band. We will assume the band does not thin out as it stretches so we will use the original cross section to calculate the stress throughout the experiment. The result of this approximation is known as the engineering stress. The original diameter of the hair tie was measured to be 2.4 mm using calipers (see image below).

4) Calculate the cross-sectional area of the hair tie in units of m2. The hair-tie was looped around the quick-links in the materials tester, so we were actually stretching two strands of the hair tie and you need to double your cross-section to account for that. Show your work.
5) Paste the Force and Displacement data into your spreadsheet. Follow the steps in the video below to calculate the stress and strain. You will need the original length, which was 2.2 cm (as seen in the first image at the beginning of the lab).
6) Plot the stress on the vertical axis and strain on the horizontal axis. Be sure to title your graph and enter axes labels with correct units.
Elastic Modulus (Young’s Modulus)
7) The elastic modulus of the material is defined as the __________ of the graph in the __________ region of the stress vs. strain curve.
8) Create a second plot that only contains the data from the linear region. Fit a line to this data and record the fit equation and the R2 here:
9) What is the elastic modulus of the hair-tie material?
10) What is the elastic modulus in units of MPa and also in units of GPa?
Ultimate Strength
11) Use your graph or examine your data direction to find the maximum stress before failure. This is known as the _________strength. What is this value in units of MPa and also in units of GPa?
Conclusions
12) Do the results support or refute your first hypothesis? Explain.
13) Do the results support or refute your second hypothesis? Explain.
14) Do the results support your third hypothesis? Explain and also cite any sources for the elastic modulus and ultimate strength of human tendon.
15) Overall, do hair-ties makes good models of tendons? Explain.

